Chapter 1.3: Data Science vs. Statistics vs. Analytics
This chapter examines the fundamental distinctions between data science, statistics, and analytics as analytical approaches. Key concepts include methodological differences, application contexts, and integration patterns that characterize modern data-driven organizations. The analysis establishes foundational understanding of when each approach provides optimal value for addressing different types of business and research challenges.
Three Analytical Perspectives: The Netflix Customer Churn Case
Netflix faces a critical business challenge shared by millions of subscription companies: customer churn. Monthly subscriber cancellations represent direct revenue loss and require expensive customer acquisition investments. Netflix’s approach to this challenge demonstrates the fundamental differences between statistics, analytics, and data science—three related but distinct methodologies for extracting value from data.
Statistical Approach: Hypothesis Testing for Causal Understanding
Netflix’s research teams conduct controlled experiments to understand the causal mechanisms underlying customer departure decisions. Using classical statistical methodology, researchers design randomized controlled trials testing specific hypotheses about retention interventions. A typical experiment might examine whether customers receiving email reminders about new content demonstrate reduced cancellation rates within 30-day periods compared to control groups.
This approach involves randomly assigning 100,000 subscribers to receive email communications while maintaining 100,000 subscribers as controls, then applying t-tests and confidence intervals to determine whether observed differences in cancellation rates achieve statistical significance. The methodology emphasizes rigorous experimental design, controlling for confounding variables, and making inferences about causal relationships rather than mere correlations.
Statistical practitioners prioritize internal validity and generalizability over immediate business application, focusing on questions of causation: “Can we demonstrate that email reminders cause reduced churn with sufficient confidence to guide broader organizational policy?”
Analytics Approach: Reporting and Business Intelligence
Netflix’s business analytics teams create comprehensive dashboard systems tracking churn metrics across multiple dimensions including geographic regions, subscription tiers, device types, and viewing behavior segments. These systems generate systematic monthly reports addressing questions such as “Which customer segments demonstrate the highest churn rates?” and “How have churn patterns evolved over the past twelve months?”
The analytics approach focuses on descriptive analysis of historical performance to inform tactical business decisions. Analytics teams excel at creating systematic reporting structures that help managers understand trends, compare performance across business units, and monitor key performance indicators over time. Their central question focuses on understanding past and current states: “What occurred, and how can systematic monitoring inform ongoing business operations?”
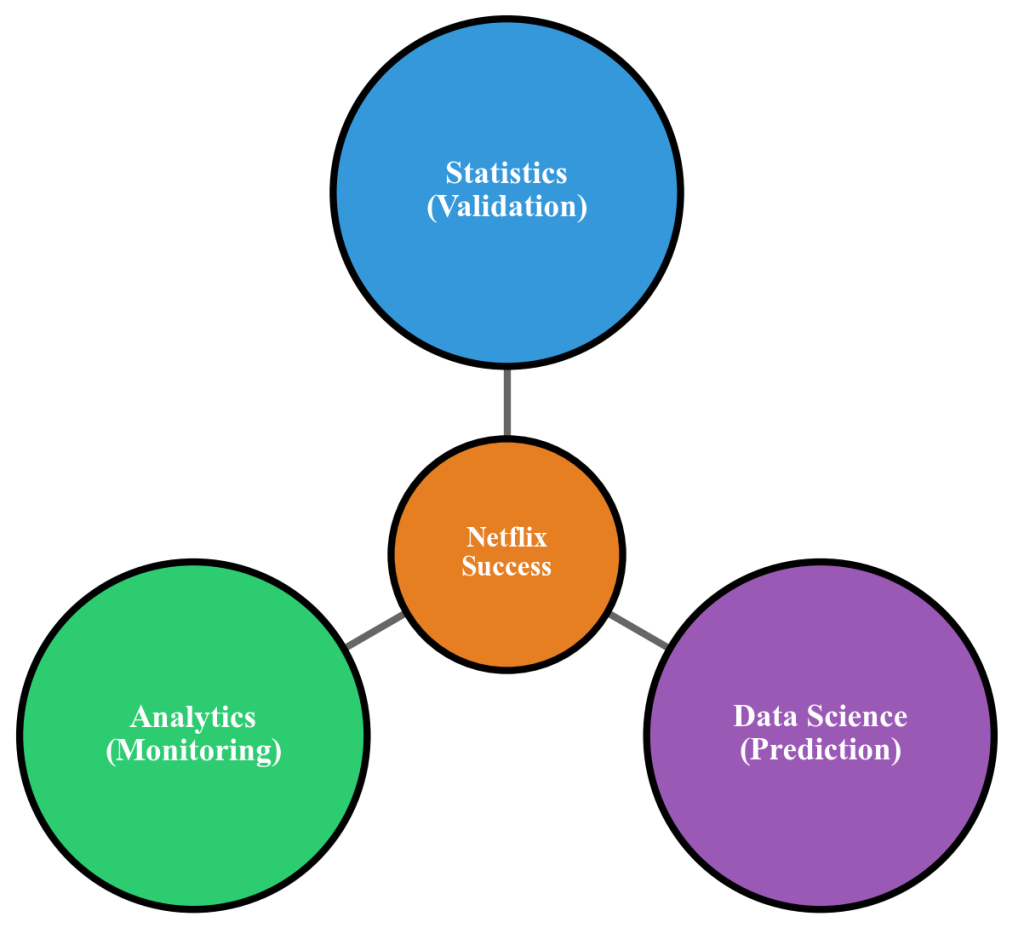
Figure 1.3.1: Netflix’s integrated analytical workflow demonstrates how statistics validates causal relationships through controlled experiments, analytics monitors business performance through systematic reporting, and data science operationalizes insights through predictive algorithms and personalized interventions. The workflow shows feedback loops connecting experimental validation to performance monitoring to automated personalization systems.
Data Science Approach: Predictive Modeling and Algorithmic Solutions
Netflix’s data science teams construct machine learning models that predict individual customer cancellation probability within specific timeframes. These systems integrate multiple data sources—viewing history, payment patterns, customer service interactions, device usage, content ratings, and external economic indicators—into sophisticated predictive algorithms that operate across millions of subscribers simultaneously.
The models extend beyond risk identification to recommend personalized interventions, such as specific content recommendations or targeted discount offers tailored to individual subscriber profiles. This approach combines programming expertise, statistical modeling capabilities, domain knowledge, and business understanding to create automated systems that generate both insights and actionable responses.
Data scientists address forward-looking operational questions: “How can we predict future outcomes and automatically implement responses that optimize business results at scale?”
Integration Creates Competitive Advantage
Netflix’s market leadership stems from strategically integrating all three analytical approaches. Statistical experiments validate that specific interventions actually work, providing causal evidence for confident decision-making. Analytics dashboards ensure leadership understands business performance and can identify emerging trends. Data science models operationalize insights automatically, personalizing experiences for over 200 million subscribers worldwide. This integration demonstrates why understanding distinctions between these approaches matters for organizations working with data—each serves distinct purposes, uses different tools and methods, and provides unique types of value.
Methodological Foundations and Historical Development
Understanding distinctions between statistics, analytics, and data science requires examining their historical development, core objectives, and methodological approaches. While these fields increasingly overlap in contemporary practice, each maintains distinct characteristics that optimize them for different problem types and organizational contexts.
Statistics: The Science of Uncertainty and Inference
Statistics emerged from 18th-century probability theory and agricultural experimentation, developing systematic approaches to making reliable inferences from limited information. Modern statistics emphasizes mathematical rigor, hypothesis testing, and drawing conclusions about populations from sample data. The field prioritizes questions of causality, statistical significance, and the methodological reliability of conclusions drawn from empirical observations.
Statistical analysis typically involves carefully designed experiments or observational studies with extensive attention to controlling confounding variables and ensuring conclusions are theoretically justified. Statistical practitioners excel at determining whether observed differences likely result from chance variations, quantifying uncertainty through confidence intervals, and designing studies that support causal claims rather than correlational associations.
Statistical Methodology Characteristics
Statistics employs hypothesis testing frameworks, confidence intervals, experimental design principles, and mathematical models with well-understood theoretical properties. Statistical practitioners use specialized software including R, SAS, and SPSS that provide extensive capabilities for classical statistical tests, assumption checking, and rigorous inferential procedures.
Analytics: The Business Application of Data Analysis
Business analytics evolved from management science and operations research traditions, focusing on practical data application to optimize business processes and support organizational decision-making. Analytics emphasizes actionable insights over theoretical rigor, prioritizing recommendations that directly inform business strategy and operational improvements.
Analytics work typically involves creating reporting systems, dashboards, and key performance indicator frameworks that help organizations monitor performance and identify opportunities. Business analysts excel at translating data patterns into actionable business recommendations, understanding relationships between different metrics and organizational goals, and communicating findings to non-technical stakeholders in formats that drive decision-making.
Analytics Methodology Characteristics
Analytics focuses on descriptive analysis, trend identification, and business intelligence techniques. Analysts employ tools including Excel, Tableau, Power BI, and SQL databases that excel at data aggregation, visualization, and report generation designed for business audiences and operational decision-making contexts.
Data Science: The Interdisciplinary Integration
Data science emerged in the 21st century as organizations encountered unprecedented volumes of complex, unstructured data that traditional approaches couldn’t handle effectively. Data science combines statistical reasoning, computer science techniques, domain expertise, and communication skills to extract insights from large, complex datasets and build systems that operate at scale.
Data science work typically involves building predictive models, creating automated systems, and developing new methodologies for handling novel data types including unstructured text, images, sensor streams, and real-time data flows. Data scientists excel at working with messy, real-world data, building scalable solutions, and creating systems that learn and adapt over time through machine learning techniques.
Data Science Methodology Characteristics
Data science employs machine learning algorithms, predictive modeling frameworks, and automated systems designed for complex pattern recognition in large datasets. Data scientists use programming languages including Python and R alongside specialized frameworks such as TensorFlow, scikit-learn, and Apache Spark that enable scalable computation and model deployment in production environments.
Operational Distinctions Across Critical Dimensions
The differences between these three approaches become clearest when examining how they handle fundamental aspects of working with data. Understanding these distinctions helps organizations choose appropriate approaches for specific problems and build teams with complementary capabilities.
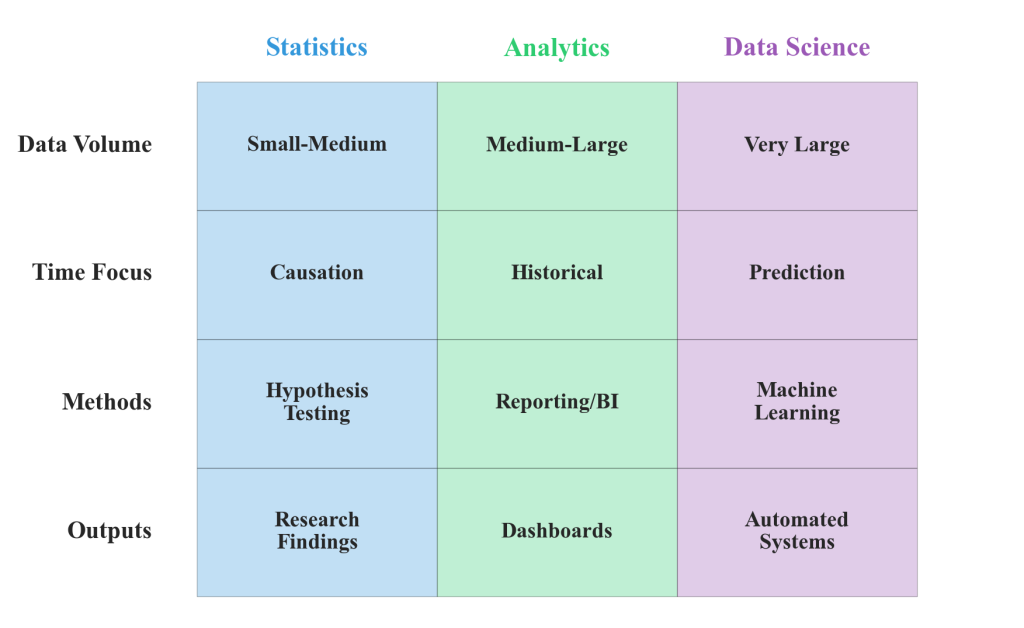
Figure 1.3.2: Comparative analysis matrix showing how statistics, analytics, and data science differ across key operational dimensions including data volume requirements, temporal focus, methodological approaches, primary tools, and typical outputs. The matrix illustrates how each approach optimizes for different organizational needs and problem contexts.
Data Volume and Computational Complexity
Statistics traditionally operates with smaller, carefully curated datasets where individual observations can be examined for quality, relevance, and conformity to theoretical assumptions. This approach enables thorough exploration of statistical assumptions underlying inferential tests and detailed examination of potential confounding factors. Statistical methods often become computationally challenging or theoretically questionable when applied to massive datasets that exceed traditional sampling frameworks.
Analytics typically processes medium to large datasets that are well-structured and stored in organizational data warehouses. The focus centers on historical business data that follows consistent formats and definitions, enabling reliable trend analysis and performance comparison over time. Analytics systems optimize for systematic reporting rather than handling novel or unstructured data types.
Data science frequently tackles very large, complex datasets that may include unstructured text, images, sensor data, or real-time streams. Data scientists develop methodologies for handling data that doesn’t conform to traditional analytical frameworks, often requiring specialized computational techniques and distributed processing systems that can scale across multiple machines or cloud computing environments.
Temporal Orientation and Decision Support
Statistics typically focuses on understanding causal relationships and making inferences that remain valid across different contexts and time periods. The emphasis lies in producing knowledge that contributes to scientific understanding or policy decisions with long-term implications, prioritizing generalizability over immediate application.
Analytics primarily examines historical data to understand past performance and current business state. The focus centers on monitoring key metrics, identifying trends, and providing situational awareness to support tactical business decisions. Analytics excels at answering “What happened?” and “How are we performing?” questions that inform short-term operational adjustments.
Data science emphasizes predicting future outcomes and building systems that automatically respond to changing conditions. The focus targets creating competitive advantages through predictive capabilities and automated decision-making systems that can operate without continuous human intervention. Data science addresses “What will happen?” and “How can we respond automatically?” questions that drive strategic advantage.
Application Contexts and Optimal Use Cases
Selecting the appropriate analytical approach depends on organizational needs, available resources, and the types of decisions requiring support. Understanding when each approach provides maximum value helps organizations allocate resources effectively and establish appropriate expectations for different types of data initiatives.
Statistics Provides Maximum Value When
Organizations need to establish causal relationships or validate intervention effectiveness in situations requiring regulatory approval, policy evaluation, or high-stakes decisions where incorrect conclusions carry significant costs. Statistics proves crucial when working with limited data but requiring high confidence in conclusions, or when evidence must withstand scientific peer review or legal scrutiny.
Statistical Application Examples
Pharmaceutical companies rely heavily on statistical methods to demonstrate drug efficacy in clinical trials, where regulatory approval requires rigorous evidence of causal effects that meet FDA standards. Educational institutions employ statistical analysis to evaluate whether new teaching methods actually improve student outcomes, controlling for factors including student background, instructor experience, and institutional resources.
Analytics Delivers Optimal Business Value When
Organizations require systematic performance monitoring, trend identification, or regular reporting to support operational decisions. Analytics excels in situations with established historical data where understanding patterns, comparing performance across business units, or tracking progress toward specific goals provides actionable insights for management decisions.
Analytics Application Examples
Retail companies employ analytics to monitor sales performance across stores, identify seasonal trends, and optimize inventory levels based on historical purchasing patterns. Healthcare organizations use analytics dashboards to track patient flow, resource utilization, and quality metrics across different departments and time periods, supporting operational efficiency and resource allocation decisions.
Data Science Creates Competitive Advantage When
Organizations need to predict future outcomes, personalize experiences at scale, or automate complex decision-making processes. Data science proves particularly powerful when dealing with large volumes of diverse data requiring systems that learn and adapt over time, creating sustainable competitive advantages through algorithmic optimization.
Data Science Application Examples
Financial services companies employ data science to detect fraudulent transactions in real-time, automatically flagging suspicious activity among millions of daily transactions using pattern recognition algorithms. E-commerce platforms use data science to personalize product recommendations for individual customers, automatically optimizing for engagement and conversion through continuous learning from user behavior patterns.
Contemporary Integration and Convergence Patterns
While understanding distinctions between these approaches remains crucial, sophisticated organizations integrate all three strategically rather than treating them as competing alternatives. This integration reflects the reality that complex business challenges benefit from multiple analytical perspectives and that boundaries between these fields continue to evolve in response to technological advancement and organizational needs.
The Modern Analytical Workflow
Leading organizations typically implement integrated workflows that leverage the comparative advantages of each approach. Analytics provides foundational infrastructure by establishing systematic data collection, quality monitoring, and performance tracking systems. This creates the reliable data foundation necessary for more sophisticated analysis while ensuring organizational stakeholders maintain situational awareness of business performance.
Statistics validates key assumptions and tests whether proposed interventions actually produce desired outcomes, providing causal evidence necessary for confident decision-making. This experimental validation prevents organizations from implementing changes based on correlations that might not represent true cause-and-effect relationships, potentially avoiding costly mistakes or missed opportunities.
Data science scales successful interventions through predictive models and automated systems, applying validated principles across large customer bases or operational contexts. This scalability enables organizations to operationalize insights in ways that create sustainable competitive advantages while maintaining quality and consistency across diverse application contexts.
Evolving Professional Skill Requirements
The convergence of these fields changes skill requirements for data professionals, with contemporary practitioners increasingly developing interdisciplinary capabilities that span traditional boundaries. Modern statisticians increasingly need programming skills to work with larger datasets and implement their methods in production systems. Business analysts add predictive modeling capabilities to provide more forward-looking insights that anticipate trends rather than merely reporting past performance.
Data scientists develop stronger experimental design skills to validate their models and ensure predictions rest on sound causal reasoning rather than spurious correlations. This convergence suggests that future data professionals will likely be more interdisciplinary than current specialists, combining statistical rigor with business understanding and technical implementation expertise.
Strategic Integration Principles
The fundamental differences in emphasis and methodology between statistics, analytics, and data science will likely persist despite increasing convergence. This makes understanding when each approach provides optimal value a crucial capability for modern organizations. The Netflix example illustrates how powerful this integration can be when implemented strategically—combining statistical validation of causal relationships, analytical monitoring of business performance, and data science automation of personalized experiences to build competitive advantages that span multiple organizational capabilities.
Foundation for Advanced Practice
This examination of distinctions and integration patterns between statistics, analytics, and data science establishes the conceptual foundation for developing practical skills that span all three approaches. Understanding how these methodologies complement each other enables more effective analytical problem-solving that chooses appropriate tools for specific challenges rather than applying familiar methods regardless of context.
The Netflix case demonstrates how organizations can achieve market leadership through strategic integration of multiple analytical approaches. This same integration pattern applies across industries and organizational contexts, making these capabilities essential for contemporary data-driven organizations. Future analytical work increasingly requires practitioners who understand both the distinctions and complementary relationships between these approaches, enabling them to design comprehensive solutions that leverage the comparative advantages of each methodology.
References
Adhikari, A., DeNero, J., & Wagner, D. (2022). Computational and inferential thinking: The foundations of data science (2nd ed.). https://inferentialthinking.com/
Irizarry, R. A. (2019). Introduction to data science: Data analysis and prediction algorithms with R. https://rafalab.dfci.harvard.edu/dsbook/
Netflix Technology Blog. (2023). Recommendation systems and machine learning. Netflix TechBlog. https://netflixtechblog.com/
Timbers, T., Campbell, T., & Lee, M. (2024). Data science: A first introduction. https://datasciencebook.ca/
