Chapter 2.3: Discrete vs. Continuous Variables
This chapter examines the fundamental classification of quantitative variables into discrete and continuous types, with emphasis on their mathematical properties, analytical implications, and practical applications in data science. The distinction between countable discrete phenomena and measurable continuous phenomena influences statistical method selection, visualization approaches, and interpretation of analytical results across all domains of empirical research and business analytics.
Fundamental Distinctions in Quantitative Data
Quantitative variables in data analysis are fundamentally classified into two distinct categories based on the nature of their possible values and the mathematical properties they exhibit. This classification influences analytical approaches, statistical methods, and interpretation of results across all domains of empirical research and business analytics.
Discrete variables represent countable quantities that take on specific, separated values with meaningful gaps between possible outcomes. Continuous variables represent measurable quantities that can theoretically assume any value within a given range, with infinite possible intermediate values.
Discrete Variables: Countable Phenomena
Discrete variables emerge from counting processes where the underlying phenomenon naturally occurs in distinct, indivisible units. The mathematical property of discrete variables lies in their integer-based nature and the existence of meaningful gaps between consecutive possible values. These variables cannot be meaningfully subdivided beyond their natural units.
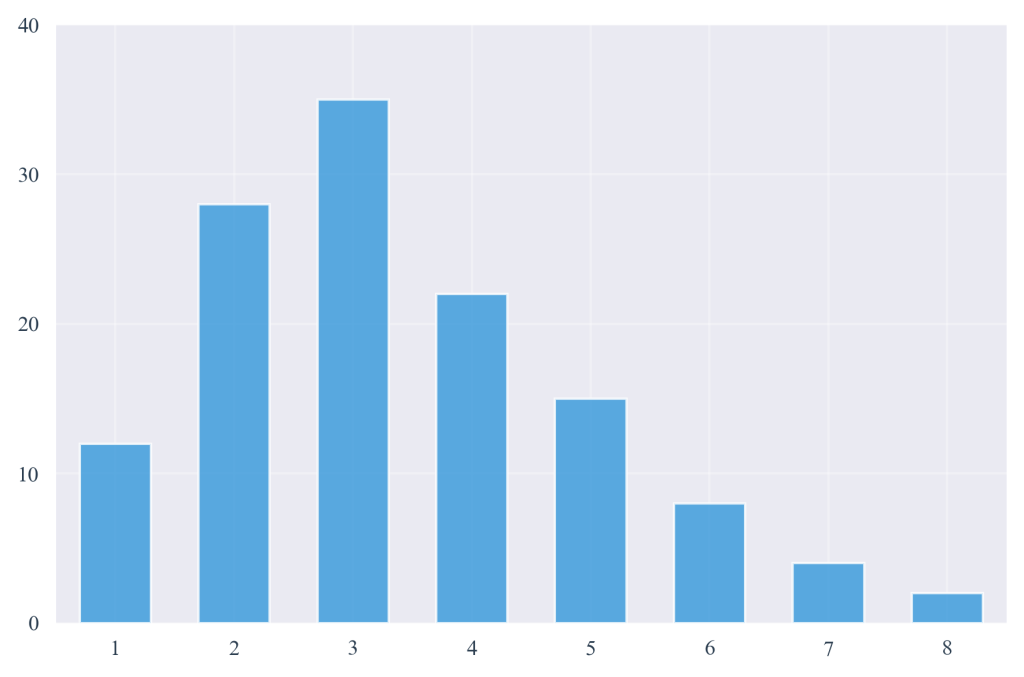
Figure 2.3.1: Distribution of discrete variables showing distinct, separated values with meaningful gaps between possible outcomes. The bar chart demonstrates how discrete variables like episode counts cannot take intermediate values between whole numbers.
Netflix’s analysis of subscriber behavior exemplifies discrete variable characteristics in contemporary business analytics. The company tracks the number of episodes watched per viewing session, with typical values ranging from 1 to 8 episodes. These counts represent discrete events where fractional values lack practical meaning—a subscriber cannot watch 2.7 episodes in any meaningful sense.
Industry Applications of Discrete Variables
Healthcare: Number of patient visits per month, count of symptoms reported, frequency of medication doses administered, number of surgical procedures performed
Manufacturing: Units produced per shift, defect counts per batch, number of quality inspections completed, frequency of equipment maintenance events
Finance: Number of transactions per account, count of loan applications processed, frequency of customer service interactions, number of investment portfolio changes
Education: Number of courses completed, count of assignments submitted, frequency of library resource usage, number of student-faculty consultations
Statistical analysis of discrete variables requires specific considerations regarding central tendency measures. While the arithmetic mean can be calculated for discrete variables, it may produce values that do not correspond to any possible outcome. The mode becomes particularly relevant for discrete data as it identifies the most frequently occurring count, providing actionable insights for business decision-making.
Continuous Variables: Measurable Phenomena
Continuous variables arise from measurement processes where the underlying phenomenon exists on an unbroken scale. The mathematical property of continuous variables lies in their infinite divisibility—between any two values, infinite intermediate values exist that can provide meaningful analytical insights.
Netflix’s measurement of viewing duration demonstrates continuous variable characteristics. A subscriber might watch content for 23.7 minutes, 45.82 minutes, or 1.239 hours. The precision of measurement is limited only by the instruments used, and increasingly precise measurements provide increasingly valuable information about user engagement patterns.
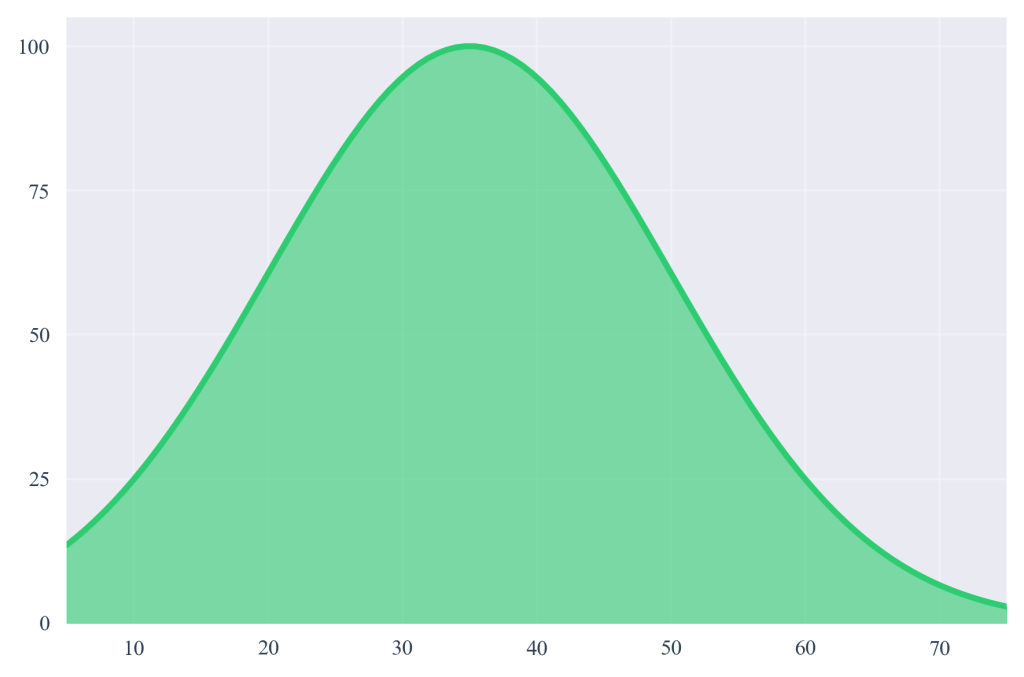
Figure 2.3.2: Distribution of continuous variables displaying smooth, connected histogram bars that represent measurable quantities. This visualization demonstrates how continuous variables like viewing duration can take any value within a range, with no meaningful gaps between possible measurements.
The business value of continuous variables lies in their mathematical properties, which enable sophisticated analytical techniques including calculus-based optimization, regression modeling, and time series forecasting. Netflix leverages these properties to predict viewing trends, optimize content recommendation algorithms, and model subscriber lifetime value with precision that discrete counting cannot provide.
Business Applications of Continuous Variables
Customer Analytics: Transaction amounts, customer lifetime value, satisfaction scores measured on continuous scales, website engagement time, response rates to marketing campaigns
Operations Management: Production cycle times, equipment efficiency ratios, inventory turnover rates, quality control measurements, resource utilization percentages
Financial Performance: Revenue figures, profit margins, return on investment calculations, risk assessment scores, market volatility indices
Human Resources: Employee performance ratings, training completion times, salary progression rates, retention probability scores, productivity metrics
Boundary Cases and Classification Challenges
The distinction between discrete and continuous variables becomes complex when measurement constraints, practical limitations, or analytical purposes influence data collection and interpretation. Many variables that appear discrete may represent measurements of underlying continuous phenomena, while apparently continuous data may be constrained by measurement precision.
Netflix’s user rating system illustrates this complexity. Historical 1-5 star ratings appeared discrete, with users selecting from five distinct categories. However, the underlying construct—user satisfaction—exists on a continuous scale. The discrete appearance resulted from interface constraints rather than the true nature of user sentiment. This distinction influences analytical approaches, as the discrete ratings require frequency analysis while the underlying continuous satisfaction could support regression modeling.
Time-based measurements present common boundary cases in business analytics. Netflix records viewing timestamps to the nearest second, creating apparently discrete data points. However, viewing duration represents an inherently continuous phenomenon where the discrete appearance results from measurement precision limitations rather than the true nature of time passage.
|
Characteristic |
Discrete Variables |
Continuous Variables |
|
Value Types |
Countable whole numbers |
Measurable quantities with infinite precision |
|
Between Values |
Meaningful gaps exist |
Infinite intermediate values possible |
|
Mathematical Properties |
Integer-based, finite possibilities within ranges |
Real number scale, infinite divisibility |
|
Statistical Implications |
Mode particularly meaningful, frequency distributions |
All central tendency measures applicable, distribution shapes |
|
Visualization Approaches |
Bar charts with gaps, frequency tables |
Line graphs, histograms with connected bars |
Analytical Implications and Method Selection
The classification of variables as discrete or continuous fundamentally influences statistical method selection, hypothesis testing approaches, and interpretation of analytical results. This distinction affects probability calculations, distribution modeling, and the appropriateness of various analytical techniques.
Probability calculations differ significantly between discrete and continuous variables. For discrete variables, probabilities are calculated for specific outcomes—such as the probability of watching exactly 3 episodes in a session. Continuous variables require probability density functions focusing on ranges rather than specific values—such as the probability that viewing duration falls between 30 and 60 minutes.
Statistical testing procedures must align with variable types to ensure valid results. Discrete variables often require non-parametric approaches or counting-based tests, while continuous variables enable parametric testing methods that assume underlying population distributions. The choice of appropriate statistical tests directly affects the validity of business conclusions drawn from analytical results.
Statistical Software Implementations
Excel Statistical Functions: The AVERAGE function provides meaningful results for continuous variables but requires careful interpretation for discrete variables where the calculated mean may not represent any possible outcome. COUNTIF functions prove particularly valuable for discrete variable frequency analysis.
JASP Analysis Procedures: The software’s statistical analysis interface adapts to variable types, offering different analytical options based on discrete or continuous classification. Automatic variable type detection requires verification to ensure appropriate analytical procedures.
KNIME Workflow Development: Different processing nodes are optimized for discrete versus continuous data processing. Understanding these distinctions enables construction of efficient and appropriate analytical workflows that leverage each variable type’s mathematical properties.
Precision and Measurement Considerations
Modern business analytics increasingly confronts questions about measurement precision and its relationship to variable classification. Digital technologies enable measurement precision that can make traditionally discrete phenomena appear continuous, while practical constraints may force continuous phenomena to be recorded as discrete categories.
Netflix’s tracking of user interactions demonstrates these precision considerations. The company can measure content engagement to millisecond precision, creating effectively continuous data from what might traditionally be considered discrete viewing events. This precision enables sophisticated analytical techniques but also raises questions about analytical value versus measurement complexity.
Ethical Implications of Measurement Precision
The ethical implications of measurement precision require consideration in business analytics. Highly precise continuous measurements of user behavior can reveal sensitive information about individuals’ daily routines, attention patterns, and personal circumstances. Organizations must balance analytical value with privacy considerations when determining appropriate measurement precision for different types of variables.
Discrete data collection presents unique privacy challenges when precise behavioral counts might be used to infer sensitive information about mental health, relationship status, or financial circumstances based on viewing frequency patterns. Data scientists must evaluate whether collecting exact discrete counts provides proportional value to potential privacy intrusions.
Integration with Data Science Practice
The discrete-continuous distinction forms a foundational element of the data understanding phase in systematic data science methodologies. This classification influences every subsequent analytical decision, from exploratory data analysis through statistical modeling to results interpretation and communication.
Contemporary data science practice requires understanding how variable types interact with automated analytical systems and machine learning algorithms. Many algorithmic approaches assume specific variable characteristics, and misclassification of discrete or continuous variables can lead to inappropriate model selection and invalid analytical conclusions.
The increasing prevalence of mixed-type datasets in business analytics requires sophisticated understanding of how discrete and continuous variables can be integrated within single analytical frameworks. Netflix’s comprehensive user behavior models demonstrate how combining discrete behavioral counts with continuous engagement measurements creates more nuanced and actionable business insights than either variable type alone.
Key Concept Integration: The distinction between discrete and continuous variables represents more than a taxonomic exercise—it fundamentally shapes analytical approach selection, statistical method appropriateness, and the validity of business conclusions drawn from data science applications. Understanding these distinctions enables data scientists to make informed decisions about analytical techniques and interpret results within appropriate methodological frameworks.
References
Adhikari, A., DeNero, J., & Wagner, D. (2022). Computational and inferential thinking: The foundations of data science (2nd ed.). https://inferentialthinking.com/
Irizarry, R. A. (2024). Introduction to data science: Data wrangling and visualization with R. https://rafalab.dfci.harvard.edu/dsbook-part-1/
Netflix, Inc. (2024). Fourth quarter 2023 financial results and outlook. Netflix Investor Relations. https://ir.netflix.net/
Timbers, T., Campbell, T., & Lee, M. (2024). Data science: A first introduction. https://datasciencebook.ca/
