Chapter 3.5: Data Formatting and Structure for Analysis
This chapter examines systematic data formatting techniques that transform clean datasets into analysis-ready structures compatible with statistical software. Key concepts include standardized date formatting procedures, numeric data preparation for calculation accuracy, text standardization for categorical analysis, and data structure organization that supports reliable statistical processing and professional reporting standards.
The Critical Role of Data Formatting in Statistical Analysis
Data formatting represents the essential bridge between data cleaning and statistical analysis, transforming cleaned datasets into structures that statistical software can process reliably. Inconsistent formatting creates barriers to analysis by preventing software from recognizing data types correctly, leading to computational errors and analytical failures that compromise research validity and business decision-making.
Professional Application: Financial Services Data Processing
Coastal Investment Group manages retirement portfolios for 12,000 clients across six regional offices. When Senior Data Analyst Marcus Chen attempted to generate quarterly performance reports for regulatory compliance, formatting inconsistencies prevented statistical software from processing client investment data correctly, threatening critical reporting deadlines that could result in regulatory penalties. The investment database contained three years of portfolio performance data, but inconsistent formatting made statistical analysis impossible.
Date fields mixed formats including “03/15/2024”, “March 15, 2024”, and “2024-03-15”, preventing time-series analysis software from recognizing temporal patterns needed for performance trending. Investment amounts appeared as currency text like “$1,250.75” and “$1250.75” rather than numeric values, breaking calculation functions that determined portfolio returns and fee calculations. Client risk tolerance ratings stored as descriptive text such as “Conservative” and “Moderate Risk” required conversion to numeric codes for statistical modeling that predicted portfolio allocation strategies.
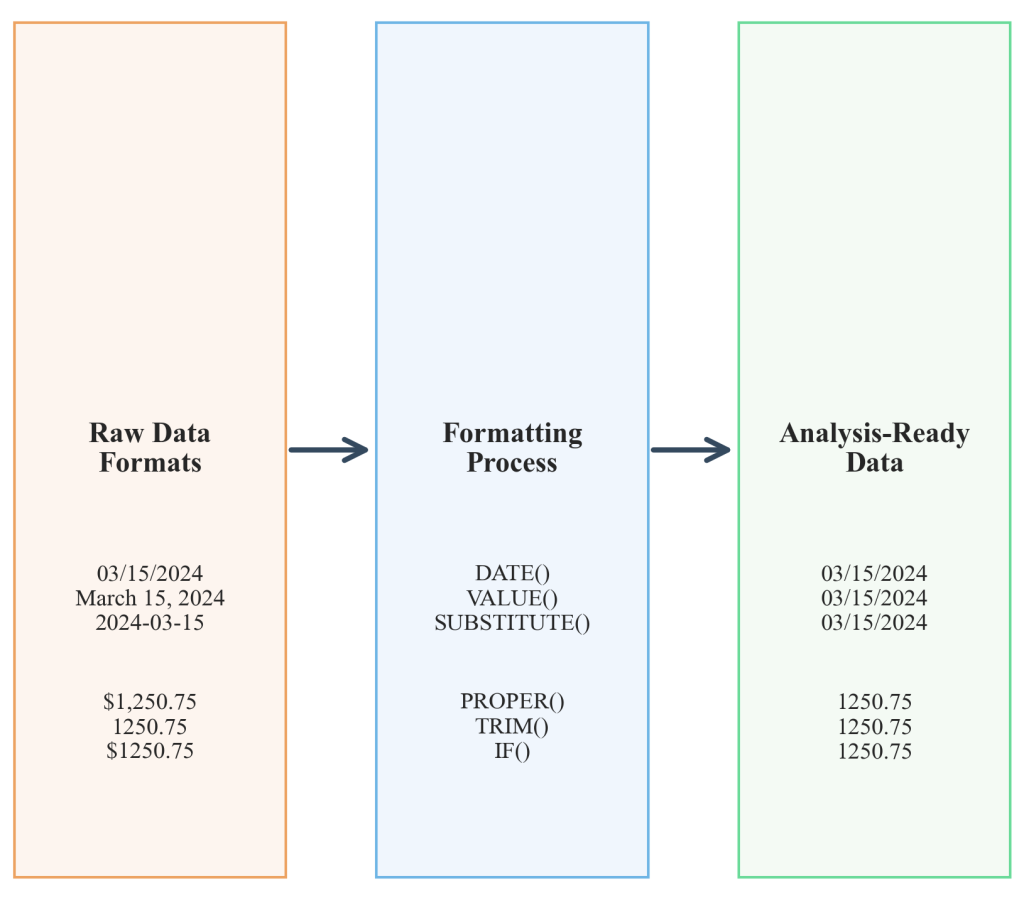
Figure 3.5.1: Visual representation of the systematic data formatting process, showing the transformation from inconsistent raw data formats through standardization procedures to analysis-ready structured datasets. This diagram illustrates how date, numeric, and categorical data undergo specific formatting procedures to achieve statistical software compatibility.
Portfolio data from different offices used varying decimal precision and number formats, creating apparent discrepancies that triggered compliance alerts and required manual investigation. Regional offices reported identical portfolio values as “125000”, “125,000.00”, and “$125,000”, causing analysis software to treat these as different values rather than equivalent amounts, which skewed performance comparisons and risk calculations.
Professional Date Formatting for Statistical Analysis
Date formatting constitutes one of the most critical aspects of data preparation because inconsistent date formats prevent temporal analysis and break statistical software functionality. Excel’s date formatting tools enable systematic standardization that ensures reliable time-series processing for financial reporting and trend analysis across organizational contexts.
Date Standardization Methodology
Mixed date formats require standardization using the DATE function combined with text parsing functions. For dates like “March 15, 2024,” the formula =DATE(RIGHT(A1,4),MONTH(DATEVALUE(LEFT(A1,FIND(” “,A1)-1)&” 1″)),MID(A1,FIND(” “,A1)+1,FIND(“,”,A1)-FIND(” “,A1)-1)) extracts components and creates proper date values. For “2024-03-15” format, =DATE(LEFT(A1,4),MID(A1,6,2),RIGHT(A1,2)) converts to Excel date format. Once converted, Format Cells > Number > Date with MM/DD/YYYY selection provides consistent display.
Professional date formatting requires consideration of analytical requirements and temporal analysis needs. The =TODAY() function enables dynamic date validation rules that automatically adjust with time passage, supporting ongoing data validation processes. The TEXT function enables custom formatting through =TEXT(A1,”MM/DD/YYYY”) while maintaining underlying date calculations essential for temporal computations. For quarterly reporting applications, =ROUNDUP(MONTH(A1)/3,0) extracts quarter numbers for grouping and analysis purposes.
Chen’s team applied date formatting using =DATE(YEAR(A1),MONTH(A1),DAY(A1)) to standardize all temporal data to MM/DD/YYYY format, enabling software to correctly sequence portfolio performance across time periods. This systematic approach included establishing format templates for future data entry, implementing conditional formatting to highlight remaining inconsistencies, and creating data validation rules that enforce format standards during input.
Numeric Formatting for Calculation Accuracy
Numeric formatting ensures statistical software recognizes quantitative data correctly while maintaining calculation precision essential for financial analysis and scientific research. Currency formatting often prevents statistical analysis by storing numbers as text rather than numeric values that support mathematical operations and computational procedures.
Currency Text Conversion Methodology
Converting currency text to numbers requires the VALUE function combined with SUBSTITUTE functions. For entries like “$1,250.75,” the formula =VALUE(SUBSTITUTE(SUBSTITUTE(A1,”$”,””),”,”,””)) removes currency symbols and thousands separators. For complex cleaning involving multiple format issues, nested substitution =VALUE(SUBSTITUTE(SUBSTITUTE(SUBSTITUTE(A1,”$”,””),”,”,””),” “,””)) handles multiple formatting problems simultaneously. Once converted, Format Cells > Number > Number with consistent decimal places provides display formatting while preserving computational capability.
Professional numeric formatting requires consistency in decimal precision across datasets to ensure accurate calculations and reliable statistical analysis. Organizational standards employ the ROUND function systematically: =ROUND(A1,2) for currency values or =ROUND(A1,4) for percentage calculations. For scientific notation requirements, Format Cells > Number > Scientific displays values like 1.25E+06 while maintaining full precision for calculations. This approach proves essential for financial datasets containing both large portfolio values and small percentage changes.
Number formatting using =VALUE(SUBSTITUTE(SUBSTITUTE(A1,”$”,””),”,”,””)) converted all currency fields to consistent decimal precision while preserving actual values, allowing accurate calculation of returns and fees across the entire portfolio database. This systematic conversion eliminated computational errors that previously compromised analytical reliability and regulatory compliance.
Text Standardization and Categorical Data Preparation
Text formatting ensures categorical data maintains consistency necessary for statistical grouping and analysis procedures. Inconsistent capitalization, spacing, and abbreviations prevent software from recognizing equivalent categories, creating artificial data segments that skew analytical results and compromise reporting accuracy across organizational systems.
Text Standardization Methodology
Text case standardization employs Excel’s text functions systematically. The formula =PROPER(TRIM(A1)) capitalizes first letters while removing extra spaces. For consistent uppercase formatting, =UPPER(TRIM(A1)) applies universally, or for lowercase requirements, =LOWER(TRIM(A1)) provides standardization. Handling multiple variations simultaneously uses nested IF statements: =IF(OR(A1=”CONSERVATIVE”,A1=”Conservative”,A1=”conservative”),”Conservative”,A1) to standardize category names across data entries.
Categorical data conversion to numeric codes enables statistical modeling while maintaining interpretability for reporting and analysis purposes. Lookup systems using VLOOKUP or INDEX/MATCH functions create systematic conversion mechanisms. For risk tolerance conversion, =VLOOKUP(A1,RiskTable,2,FALSE) references a table where RiskTable contains text descriptions in column 1 and numeric codes in column 2. Direct conversion applies conditional logic through =IF(A1=”Conservative”,1,IF(A1=”Moderate”,2,IF(A1=”Aggressive”,3,”Error”))) to ensure consistent numeric encoding for statistical analysis.
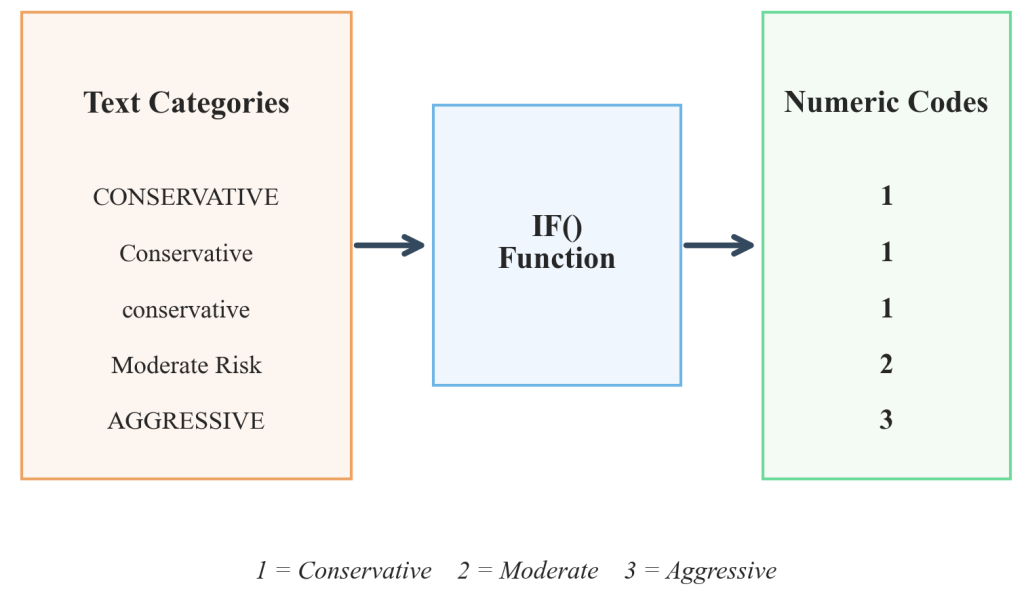
Figure 3.5.2: Systematic framework showing the conversion of inconsistent categorical text data into standardized numeric codes suitable for statistical analysis. This framework demonstrates the relationship between text standardization procedures and numerical encoding systems that maintain data interpretability while enabling computational analysis.
Text standardization using =IF(A1=”Conservative”,1,IF(A1=”Moderate”,2,3)) converted risk tolerance categories to numeric codes while maintaining lookup tables for report generation. This approach eliminated category recognition errors that previously prevented accurate risk analysis and portfolio allocation modeling.
Data Structure Layout for Statistical Software Compatibility
Professional data structure follows statistical software conventions that enable seamless import and processing across analytical platforms. Data arrangement in rectangular format with variables as columns and observations as rows avoids merged cells, blank rows, or embedded subtotals that interfere with software parsing and create import errors that delay analysis workflows.
Header Row Formatting Methodology
Header row formatting requires attention to analytical software requirements and naming conventions. Single-row headers with unique, descriptive names beginning with letters rather than numbers provide universal compatibility. Consistent naming conventions employ Portfolio_Value, Risk_Score, and Performance_Ratio instead of spaces or special characters that prevent variable name conflicts. Lengthy descriptions create display issues in statistical output tables and should be avoided in favor of concise, descriptive names.
Clear data boundaries using the Format as Table feature create structured references that adapt automatically as data expands. Selecting the data range and applying Insert > Table enables features like automatic filtering and structured formulas. Table[Portfolio_Value] references instead of cell ranges for formulas maintain accuracy when data grows. This structured approach prevents common import errors where software misinterprets data ranges or includes formatting elements as analytical data points.
Implementation Results
The systematic formatting approach resulted in a fully analysis-ready dataset that enabled automated statistical processing, reduced manual data preparation time by 75%, and ensured regulatory reports met compliance standards for accuracy and consistency across all regional offices. The formatting templates and validation rules established sustainable standards for ongoing data collection and processing.
Industry Applications and Professional Standards
Systematic formatting approaches scale across different data sizes and organizational contexts without requiring manual intervention or platform-specific modifications. Professional formatting standards reduce errors and improve reproducibility across analytical workflows and team collaboration environments. Proper data structure supports advanced statistical techniques and prevents common analytical errors that compromise research validity and business decision-making.
Cross-Industry Applications
Financial Services: Investment firms format client portfolio data for regulatory reports, ensuring consistent currency formats and standardized risk category codes for compliance analysis. Healthcare Systems: Hospital administrators format patient data for compliance reporting, ensuring consistent date formats for treatment timelines and standardized numeric codes for medical procedures. Retail Operations: Store managers format sales data for quarterly reports, standardizing product codes and prices across multiple locations for accurate inventory analysis and profit calculations.
Data format choices determine which analytical techniques are possible and reliable for research and business applications. Well-formatted data structures enable systematic computational analysis without processing errors or manual corrections. Professional formatting standards support reproducible research and analytical collaboration across different software platforms and organizational systems.
Establishing format templates for future data entry, implementing conditional formatting to highlight remaining inconsistencies, and creating data validation rules that enforce format standards during input ensure sustained compliance and analytical reliability. These systematic approaches prevent common import errors and support seamless integration across statistical software platforms used in professional environments.
References
Adhikari, A., DeNero, J., & Wagner, D. (2022). Computational and inferential thinking: The foundations of data science (2nd ed.). https://inferentialthinking.com/
Irizarry, R. A. (2024). Introduction to data science: Data wrangling and visualization with R. https://rafalab.dfci.harvard.edu/dsbook-part-1/
Microsoft Corporation. (2024). Format numbers as dates or times. https://support.microsoft.com/en-us/office/format-numbers-as-dates-or-times-418bd3fe-0577-47c8-8caa-b4d30c528309
Stony Brook University Libraries. (2024). Data cleaning and wrangling guide. https://guides.library.stonybrook.edu/data-cleaning-and-wrangling
Timbers, T., Campbell, T., & Lee, M. (2024). Data science: A first introduction. https://datasciencebook.ca/
