Chapter 4.2: Foundations of Exploratory Data Analysis
This chapter examines the systematic investigation of datasets through exploratory data analysis (EDA), a fundamental methodology that discovers patterns, identifies relationships, and formulates hypotheses that guide subsequent analytical work. Key concepts include the strategic role of EDA within the CRISP-DM data science lifecycle, systematic exploration frameworks that distinguish professional practice from ad-hoc investigation, and quality assurance approaches that validate both data integrity and analytical effectiveness.
Definition and Core Principles of Exploratory Data Analysis
Exploratory Data Analysis represents the systematic investigation of datasets to discover patterns, identify relationships, detect anomalies, and formulate hypotheses that guide subsequent analytical work. Unlike confirmatory analysis that tests specific hypotheses, EDA emphasizes open-ended discovery that reveals unexpected insights and informs analytical strategy (Timbers et al., 2024).
EDA serves multiple critical functions within professional data science practice: quality assurance to verify that cleaned data behaves as expected, pattern recognition to identify trends and relationships worthy of deeper investigation, and hypothesis generation to guide formal statistical testing. This investigative approach distinguishes systematic exploration from ad-hoc data browsing.
Effective EDA follows established principles that ensure comprehensive and efficient exploration. The principle of progressive disclosure suggests starting with simple descriptive statistics and high-level patterns before proceeding to complex relationships and detailed analysis. This approach prevents analytical overwhelm while ensuring that fundamental data characteristics are understood before advanced techniques are applied.
The principle of multiple perspectives requires examining data from various angles—temporal, categorical, geographic, and demographic—to ensure that important patterns are not missed due to limited viewpoints. Professional EDA maintains detailed records of findings and anomalies discovered during exploration, creating reproducible analysis processes that support team collaboration and stakeholder communication (Irizarry, 2024).
Strategic Role in Data Science Methodology
Within the CRISP-DM methodology, EDA represents the analytical bridge between Data Understanding and Modeling phases, serving as both the culmination of data preparation efforts and the foundation for advanced analytical techniques. The Data Understanding phase involves initial data collection and description, while EDA provides systematic exploration that transforms surface-level familiarity into deep analytical insight.
EDA serves as a critical quality gate that validates the effectiveness of data preparation work. Systematic exploration reveals whether cleaning procedures successfully addressed data quality issues, whether validation rules prevent problematic data entry, and whether data formatting supports intended analytical approaches. When EDA reveals unexpected patterns or anomalies, it often indicates the need for additional data preparation rather than immediate modeling.
The iterative nature of CRISP-DM means that EDA findings frequently drive modifications to business understanding and data collection strategies. Patterns discovered during exploration may reveal that initial business questions were too narrow or that additional data sources are needed to address strategic objectives adequately. This feedback loop between exploration and problem definition distinguishes mature data science practice from linear analytical approaches.
Systematic Exploration Framework
Successful EDA requires strategic planning that balances comprehensive coverage with efficient resource allocation. Effective exploration strategies begin with clear articulation of business questions and analytical objectives that guide exploration priorities. Rather than random data browsing, systematic EDA follows structured approaches that ensure important patterns are discovered while avoiding analytical paralysis.
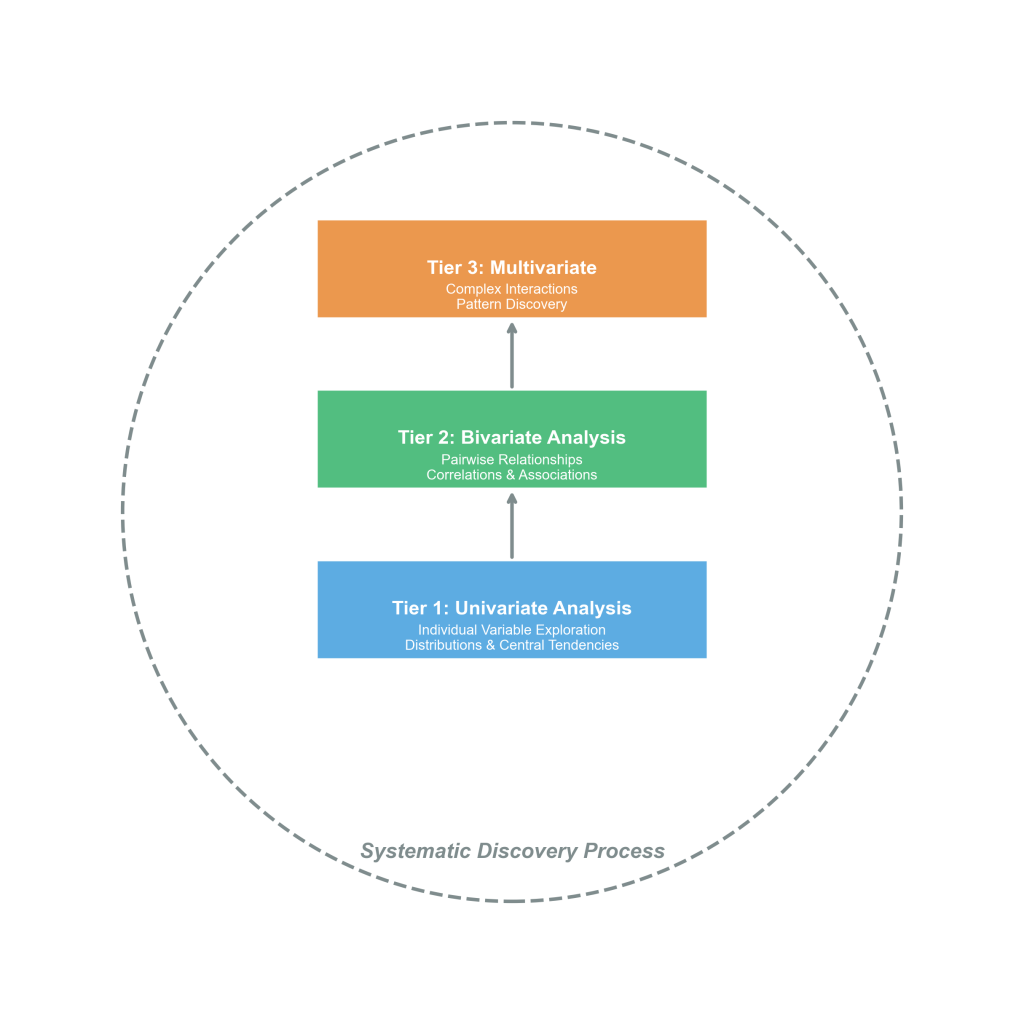
Figure 4.2.1: The systematic three-tier framework for comprehensive exploratory data analysis arranged in pyramid structure. Tier 1 displays individual variable icons representing distributions and central tendencies, Tier 2 shows paired variable representations for correlations and associations, and Tier 3 presents complex network diagrams for multivariate interactions. Progressive discovery arrows flow upward while feedback arrows enable deeper investigation, all within the Systematic Discovery Process boundary that distinguishes professional exploration from random data browsing.
The three-tier exploration framework provides systematic structure for EDA planning. Univariate analysis examines individual variables to understand distributions, central tendencies, and variability patterns that inform subsequent analysis. Bivariate analysis explores relationships between pairs of variables to identify correlations, associations, and potential cause-effect relationships. Multivariate analysis investigates complex interactions among multiple variables simultaneously, revealing patterns that simple pairwise analysis might miss.
This systematic framework ensures comprehensive exploration while preventing analytical overwhelm. Beginning with univariate analysis establishes fundamental data characteristics and quality baselines before proceeding to relationship discovery. The progressive nature allows analysts to build understanding systematically, with each tier informing the focus and priorities for subsequent exploration.
Professional Implementation and Tool Integration
Tool selection plays a crucial role in exploration strategy effectiveness. Excel statistical functions and pivot tables provide accessible entry points for initial exploration, while JASP analytical interface enables sophisticated statistical analysis that scales to larger datasets and complex analytical requirements. The combination of these tools supports progressive exploration that begins with simple descriptive analysis and advances to comprehensive statistical investigation as patterns emerge.
Excel EDA Methodology: Statistical functions (=AVERAGE, =MEDIAN, =STDEV), Data Analysis ToolPak for advanced descriptive statistics, PivotTables for categorical analysis and cross-tabulation, conditional formatting for pattern visualization, and chart creation for distribution analysis.
JASP EDA Implementation: Descriptive statistics modules for comprehensive univariate analysis, correlation matrices for bivariate relationship exploration, distribution testing for normality assessment, and publication-quality output generation for professional reporting.
Quality Assurance and Validation Approaches
Professional EDA incorporates systematic quality assurance measures that validate both data integrity and analytical approach effectiveness. These measures include verification that cleaned data behaves consistently with business understanding, identification of potential data quality issues that escaped initial preparation phases, and assessment of whether exploration strategies adequately address business questions and analytical objectives.
Professional EDA distinguishes between expected and unexpected patterns, ensuring that novel discoveries receive appropriate validation before informing business decisions. This validation approach prevents analytical bias while ensuring that genuine insights are identified and communicated effectively to stakeholders.
Effective EDA maintains continuous integration with business context throughout the exploration process. This integration ensures that statistical patterns are evaluated against operational realities, that discovered relationships align with business logic, and that exploration findings can be translated into actionable recommendations. Business context integration distinguishes valuable insights from statistical artifacts that lack practical significance.
Enterprise Application Case Study
FreshMarket Online Strategic Transformation: A regional grocery delivery service with 2.8 million customers implemented systematic EDA across 18 months of transaction data containing over 12 million transactions. The systematic exploration revealed that 23% of customers accounted for 67% of delivery costs due to frequent small orders in geographically dispersed locations. Geographic analysis showed suburban customers averaged $127 per order compared to $89 for urban customers, but suburban delivery costs were proportionally higher due to route inefficiencies. Customer segmentation analysis revealed five distinct purchasing profiles requiring different service strategies. These EDA-driven insights enabled strategic service modifications that improved profit margins by 12% within six months while maintaining customer satisfaction scores above 4.6 out of 5.0.
Documentation and Reproducibility Standards
Professional EDA maintains systematic documentation that ensures reproducible analysis processes and supports knowledge transfer within organizational teams. This documentation includes detailed records of exploration strategies employed, patterns and anomalies discovered during investigation, and decisions made regarding subsequent analytical approaches. Such documentation practices distinguish professional data science work from ad-hoc analytical efforts.
The systematic nature of EDA differentiates professional data science practice from casual data exploration. Professional EDA follows documented workflows that ensure comprehensive coverage of important analytical questions, maintains detailed records of findings and anomalies discovered during exploration, and creates reproducible analysis processes that support team collaboration and stakeholder communication (Adhikari et al., 2022).
References
Adhikari, A., DeNero, J., & Wagner, D. (2022). Computational and inferential thinking: The foundations of data science (2nd ed.). https://inferentialthinking.com/
Irizarry, R. A. (2024). Introduction to data science: Data wrangling and visualization with R. https://rafalab.dfci.harvard.edu/dsbook-part-1/
Timbers, T., Campbell, T., & Lee, M. (2024). Data science: A first introduction. https://datasciencebook.ca/
