Chapter 4.5: Measures of Central Tendency
This chapter examines the three fundamental measures of central tendency—mean, median, and mode—that quantify the typical values characterizing dataset distributions. These statistical measures provide essential foundations for business decision-making by identifying representative values that guide strategic analysis and operational improvements across diverse organizational contexts.
The Strategic Role of Central Tendency in Business Analytics
Central tendency measures transform raw business data into actionable insights by identifying the most representative values within datasets. These statistical foundations enable organizations to move beyond individual data points toward systematic understanding of customer behaviors, operational patterns, and performance characteristics that drive strategic decision-making.
Business Applications: Central tendency analysis supports diverse organizational functions including customer experience optimization, inventory management, quality control, financial planning, and performance benchmarking. These measures provide the quantitative foundation for evidence-based decision-making across departments and organizational levels.
Case Study: Customer Experience Optimization Through Central Tendency Analysis
MegaRetail, operating 1,247 stores across 38 states with annual revenues exceeding $8.6 billion, demonstrates the strategic value of systematic central tendency analysis in customer experience management. When Chief Customer Experience Officer David Park examined quarterly customer satisfaction data, traditional reporting showed promising aggregate scores averaging 7.8 out of 10, suggesting consistent positive performance organization-wide.
However, comprehensive central tendency analysis revealed critical insights hidden within simple averages. While mean satisfaction scores averaged 7.8, median scores consistently measured 8.4, indicating that approximately half of customers experienced satisfaction above the mathematical average. Most significantly, mode analysis revealed that the most frequently occurring satisfaction rating was 9 out of 10, suggesting that typical customer experiences were substantially more positive than mathematical averages indicated.
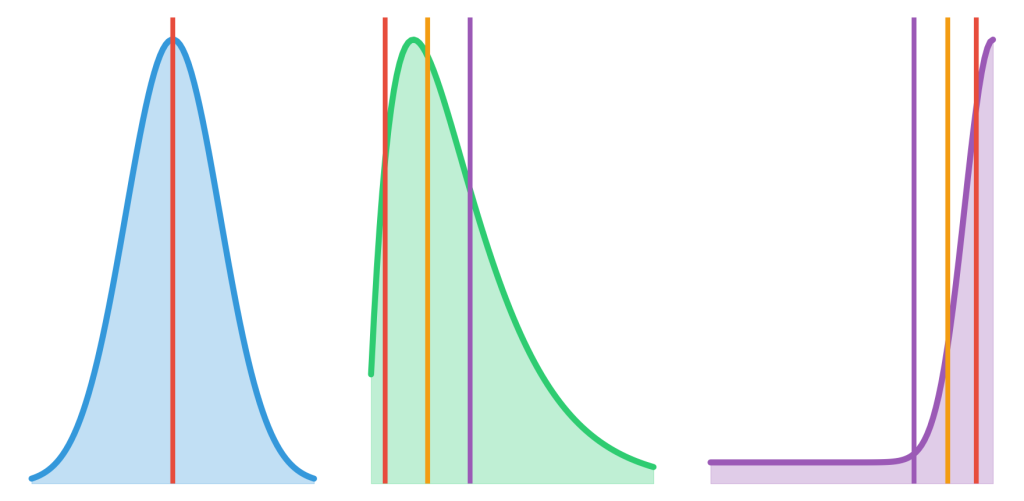
Figure 4.5.1: Distribution comparison showing how different central tendency measures reveal distinct business insights. The visualization demonstrates typical patterns where mean, median, and mode provide complementary perspectives on customer satisfaction, employee performance, and sales data distributions commonly encountered in business analytics.
Geographic segmentation revealed striking regional variations in central tendency patterns. Urban stores demonstrated mean satisfaction of 7.2 with median of 8.1, indicating significant variability and concerning outlier experiences that required immediate attention. Suburban locations showed more consistent performance with mean satisfaction of 8.3 and median of 8.5, suggesting stable operational processes.
These insights enabled targeted improvement strategies addressing specific distribution characteristics. Checkout process improvements focused on eliminating extreme negative experiences that pulled means below medians, while inventory management concentrated on reducing stockout frequency to align mean scores with consistently high mode values. Within four months, statistically-informed interventions increased mean customer satisfaction to 8.4 while maintaining median scores above 8.7.
The Arithmetic Mean: Mathematical Center and Business Applications
The arithmetic mean represents the mathematical center of a dataset, calculated by summing all values and dividing by the total number of observations. This measure provides the balance point where values above and below the mean offset each other, making it particularly valuable for normally distributed business data where values cluster symmetrically around a central value.
Excel Implementation: The AVERAGE() function automates mean calculations for datasets of any size. JASP’s Descriptive Statistics module provides means alongside confidence intervals and other interpretive measures that enhance business interpretation and statistical inference capabilities.
Business applications of the mean span virtually every analytical context where mathematical operations make conceptual sense. Financial metrics including average revenue per customer, mean transaction values, and average profit margins provide essential benchmarks for performance evaluation and strategic planning. Operational measures such as mean processing times, average quality scores, and mean productivity rates enable systematic comparison across teams, time periods, and organizational units.
Critical Consideration: The mean’s sensitivity to extreme values requires careful interpretation in business contexts. When datasets contain outliers or follow skewed distributions, means can misrepresent typical experiences and lead to inappropriate business decisions. A few exceptionally large sales transactions can inflate average revenue figures above what most customers actually spend, while a small number of delayed orders can make average delivery times appear worse than most customers experience.
The Median: Robust Center for Skewed Business Data
The median represents the middle value when observations are arranged in ascending order, effectively dividing the dataset into two equal halves. This positional measure resists the influence of extreme values, providing more representative central tendency for skewed distributions common in business contexts.
Statistical Implementation: Excel’s MEDIAN() function handles median calculations automatically, while JASP provides medians within comprehensive distributional analysis that includes quartile information and percentile rankings essential for thorough business interpretation.
Business scenarios where medians provide superior insights include income distributions, sales figures, customer spending patterns, and response times. These contexts typically feature natural lower boundaries with unlimited upper potential, creating right-skewed distributions where means exceed medians due to exceptional high values. Understanding this relationship enables analysts to distinguish between mathematical averages and typical customer experiences.
The median’s interpretive power lies in its resistance to outlier influence and its intuitive meaning for business stakeholders. When median household income exceeds mean income in a market area, it suggests relatively equitable income distribution with few extremely high earners. Conversely, when mean customer spending significantly exceeds median spending, it indicates that a small percentage of high-value customers drive disproportionate revenue, requiring different retention strategies for different customer segments.
The Mode: Most Common Value and Operational Insights
The mode identifies the most frequently occurring value in a dataset, providing insights into typical operational patterns and customer behaviors that averages might overlook. Unlike mean and median, mode applies to all data types including categorical information, making it particularly valuable for analyzing customer preferences, product choices, and service patterns.
Analytical Techniques: Excel’s MODE.SNGL() function identifies single modes in numeric data, while frequency analysis using PivotTables reveals modal categories for text-based variables. Advanced analysis may require MODE.MULT() for datasets with multiple equally frequent values.
Business applications of mode analysis include identifying the most popular product sizes, common customer complaint categories, frequent transaction amounts, and typical service delivery times. These insights inform inventory planning, staffing decisions, and process optimization by revealing operational patterns that occur most frequently rather than mathematical averages that might not represent any actual customer experience.
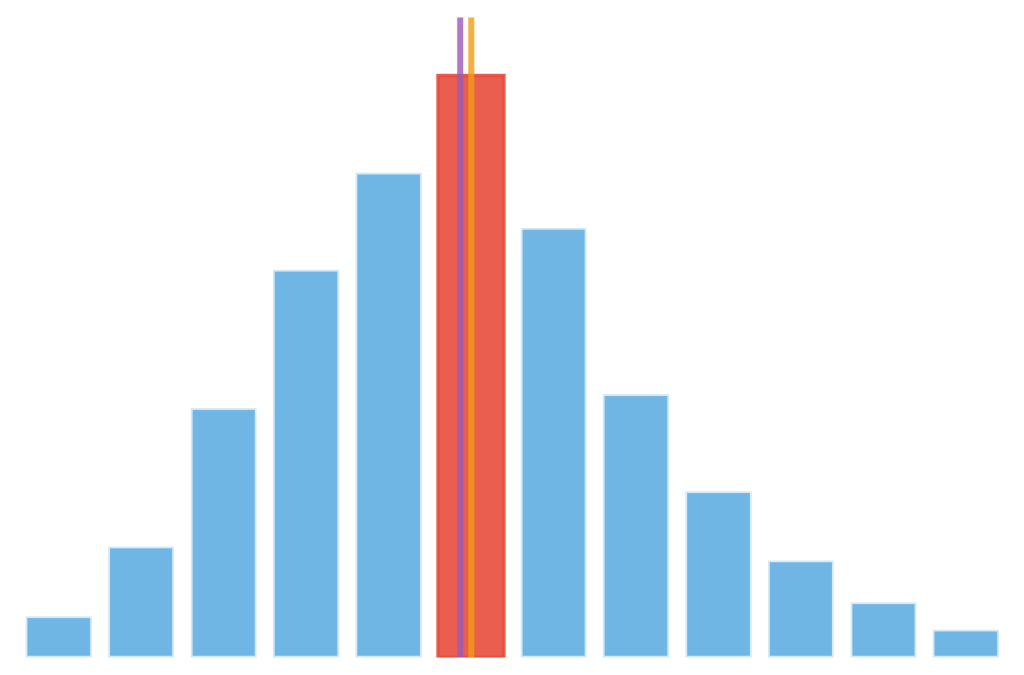
Figure 4.5.2: Frequency distribution of customer service response times demonstrating modal analysis in operational contexts. The visualization highlights the most common operational outcome (mode) while showing mean and median positions, illustrating how frequency-based analysis reveals operational patterns that mathematical averages might obscure in quality control and process improvement initiatives.
Mode analysis proves especially valuable for quality control and process improvement initiatives. When the most common production output differs significantly from target specifications, it indicates systematic process issues requiring operational adjustment. Similarly, when the most frequent customer service interaction involves specific problem types, it suggests opportunities for proactive communication or product improvement that addresses root causes rather than reactive problem resolution.
Comparative Analysis and Strategic Selection
Effective central tendency analysis requires systematic comparison of all three measures to understand distribution characteristics and select appropriate representations for specific business contexts. The relationship between mean, median, and mode reveals distribution shape and guides interpretation strategies that support accurate business decision-making.
Distribution Patterns: When mean equals median equals mode, data follows approximately normal distribution suitable for parametric analysis. When mean exceeds median, data demonstrates right skewness common in sales and income data. When median exceeds mean, data shows left skewness typical in performance ratings and satisfaction scores approaching ceiling effects.
Strategic selection of central tendency measures depends on analytical objectives, data characteristics, and stakeholder communication needs. Financial reporting often emphasizes means for mathematical precision, while operational analysis may prioritize medians for typical performance assessment. Customer experience analysis frequently benefits from mode identification to understand most common interaction patterns.
Integration with Business Intelligence Systems
Modern business intelligence implementations integrate central tendency calculations within automated reporting systems that provide real-time insights for operational management and strategic planning. Excel-based dashboards incorporate AVERAGE(), MEDIAN(), and MODE.SNGL() functions within dynamic visualizations that update automatically as new data becomes available.
Advanced Integration: JASP integration enables sophisticated statistical analysis that complements Excel calculations with confidence intervals, hypothesis testing, and distributional assessment capabilities essential for evidence-based business decision-making in complex organizational contexts.
Successful implementation requires consideration of data quality, distribution characteristics, and stakeholder interpretation capabilities. Training programs ensure that business users understand when different measures provide most appropriate insights, while automated systems incorporate validation rules that flag unusual patterns requiring analytical attention.
Key Concepts Summary
Central tendency measures provide fundamental statistical foundations for business analytics by quantifying representative values within datasets. The arithmetic mean offers mathematical precision suitable for normally distributed data, while the median provides robust alternatives for skewed distributions common in business contexts. The mode reveals operational patterns and frequency-based insights unavailable through mathematical averages.
Effective application requires systematic comparison of all three measures to understand distribution characteristics and select appropriate representations for specific analytical objectives. Integration with Excel and JASP tools enables efficient calculation and sophisticated interpretation that supports evidence-based decision-making across organizational levels and functional areas.
Foundation for Advanced Analysis: Mastery of central tendency concepts establishes essential foundations for subsequent statistical analysis including variability measures, hypothesis testing, and predictive modeling techniques that extend basic descriptive analysis toward comprehensive business intelligence capabilities.
References
Adhikari, A., DeNero, J., & Wagner, D. (2022). Computational and inferential thinking: The foundations of data science (2nd ed.). https://inferentialthinking.com/
Irizarry, R. A. (2024). Introduction to data science: Data wrangling and visualization with R. https://rafalab.dfci.harvard.edu/dsbook-part-1/
Microsoft Corporation. (2024). Statistical functions reference. https://support.microsoft.com/en-us/office/statistical-functions-reference-624dac86-a375-4435-bc25-76d659719ffd
Timbers, T., Campbell, T., & Lee, M. (2024). Data science: A first introduction. https://datasciencebook.ca/
