Chapter 6.4: Correlation Analysis and Relationship Interpretation
This chapter examines the principles and applications of correlation analysis for quantifying relationships between continuous variables in business and research contexts. Key concepts include Pearson correlation coefficients, the critical distinction between correlation and causation, scatterplot analysis techniques, and the assumptions underlying valid correlation interpretation.
Understanding Pearson Correlation Coefficients
Pearson correlation coefficients quantify the strength and direction of linear relationships between two continuous variables, providing business analysts with standardized measures that range from -1.00 to +1.00 and enable systematic comparison of relationship strength across different business contexts. The correlation coefficient (r) indicates both the direction of the relationship through its sign and the strength through its absolute value, with values closer to -1 or +1 representing stronger linear associations that support more confident business predictions and strategic planning.
Correlation Strength Interpretation Guidelines:
Correlations between 0.70 and 1.00 (or -0.70 and -1.00) represent strong relationships indicating that changes in one variable correspond closely to changes in the other. Moderate correlations between 0.30 and 0.69 suggest meaningful but less predictable relationships, while weak correlations below 0.30 indicate minimal linear association that may not support reliable business predictions without additional analysis.
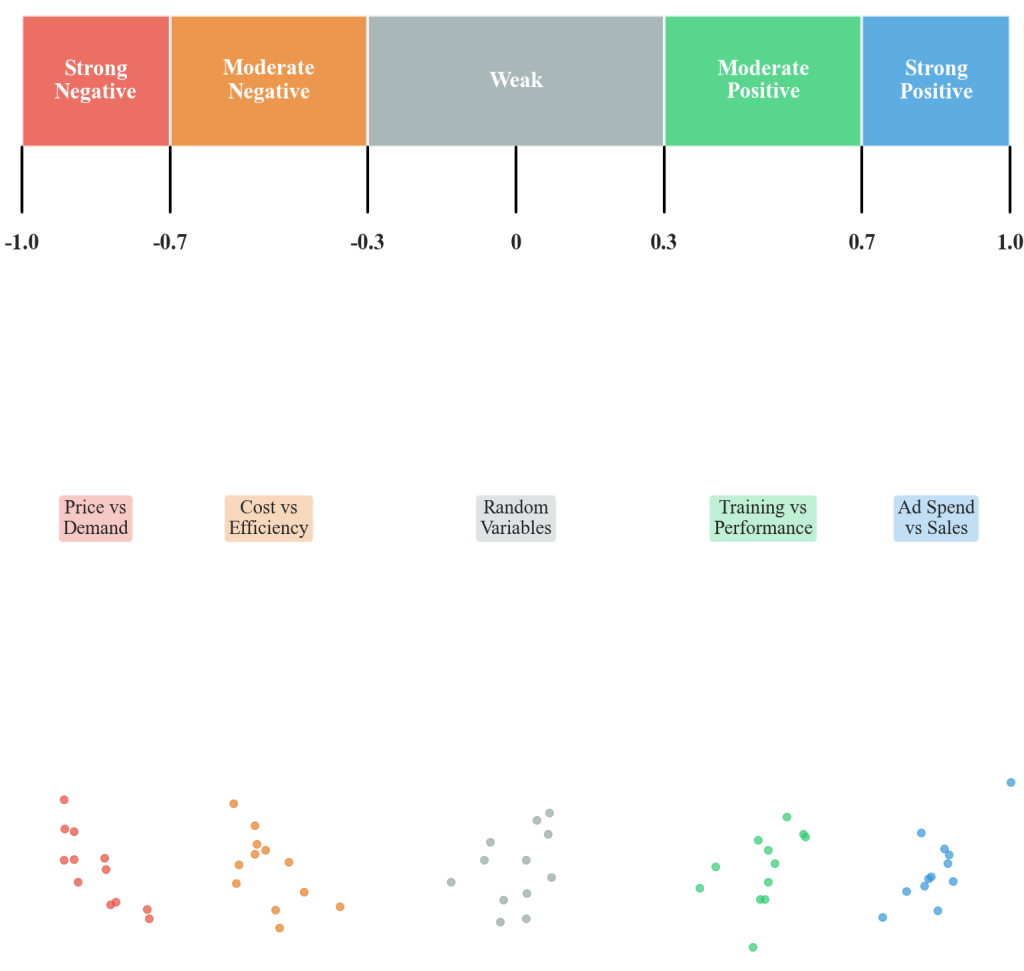
Figure 6.4.1: Visual reference guide displaying correlation coefficient ranges from -1.00 to +1.00 with color-coded strength categories and business application examples. This guide demonstrates how different correlation values translate to relationship strength in practical business contexts, supporting appropriate interpretation of statistical analysis results.
Correlation Versus Causation: Critical Business Distinctions
The fundamental distinction between correlation and causation represents one of the most important concepts in business analytics, preventing costly strategic errors that occur when organizations assume statistical relationships imply causal mechanisms without proper experimental validation. Correlation analysis reveals whether two variables tend to change together systematically, but correlation alone cannot determine whether changes in one variable actually cause changes in another, requiring additional research designs and analytical approaches to establish causal relationships.
Critical Interpretation Framework:
Business applications require careful interpretation that acknowledges correlation limitations while leveraging relationship insights appropriately for strategic planning. Statistical relationships provide valuable evidence for decision-making when combined with theoretical understanding, experimental validation, and consideration of confounding variables that might influence observed associations.
Consumer Packaged Goods Marketing Analysis Case
A major consumer packaged goods brand faced mounting pressure from executive leadership to demonstrate the return on investment for their substantial marketing expenditures, particularly their video-first media strategy implemented across multiple retail channels. With annual marketing investments exceeding $25 million and no direct conversion tracking available for in-store sales, the company required rigorous statistical analysis to prove that media spending actually drove business results rather than representing operational costs without measurable impact.
Analytical Framework Implementation:
Stellar Rising agency partnered with the CPG brand to implement a comprehensive correlation analysis framework that quantified relationships between media spending, brand awareness metrics, and sales performance across retail channels. The research design incorporated monthly brand health tracking surveys measuring top-of-mind awareness, purchase intent, aided and unaided awareness, and advertising recall among target demographic panels.
The correlation analysis revealed compelling statistical relationships that transformed the company’s understanding of their marketing effectiveness. The analysis showed that relative lift in awareness among the target demographic had a 75% correlation (r = 0.75) with media spend, demonstrating a strong positive relationship where approximately 56% of the variance in awareness levels could be explained by media spending patterns.
Secondary analysis examining the relationship between aided awareness lift and household penetration improvements revealed a strong 70% correlation (r = 0.70) between awareness gains and actual market penetration, despite brand inventory issues during the measurement period. The statistical significance of this correlation (p < 0.001) provided compelling evidence that awareness improvements translated directly into expanded market reach, generating a 7% lift in sales and an efficient return on advertising spend (ROAS) of $1.81 for every dollar invested.
Scatterplot Analysis and Relationship Patterns
Scatterplot visualizations provide essential insights into relationship patterns that correlation coefficients alone cannot reveal, enabling analysts to identify non-linear relationships, outliers, and data distribution characteristics that influence correlation interpretation and business decision-making. Visual analysis through scatterplots helps determine whether linear correlation measures appropriately represent the actual relationship pattern, supporting more accurate business conclusions and strategic planning based on relationship analysis results.
Effective scatterplot interpretation examines multiple characteristics including overall pattern direction, relationship linearity, data point clustering, and outlier presence that could influence correlation calculations. Strong linear relationships appear as data points forming clear upward or downward trending patterns, while weak relationships show scattered points with no discernible pattern. Non-linear relationships may show curved patterns that correlation coefficients underestimate, requiring alternative analytical approaches for accurate business interpretation and strategic application.
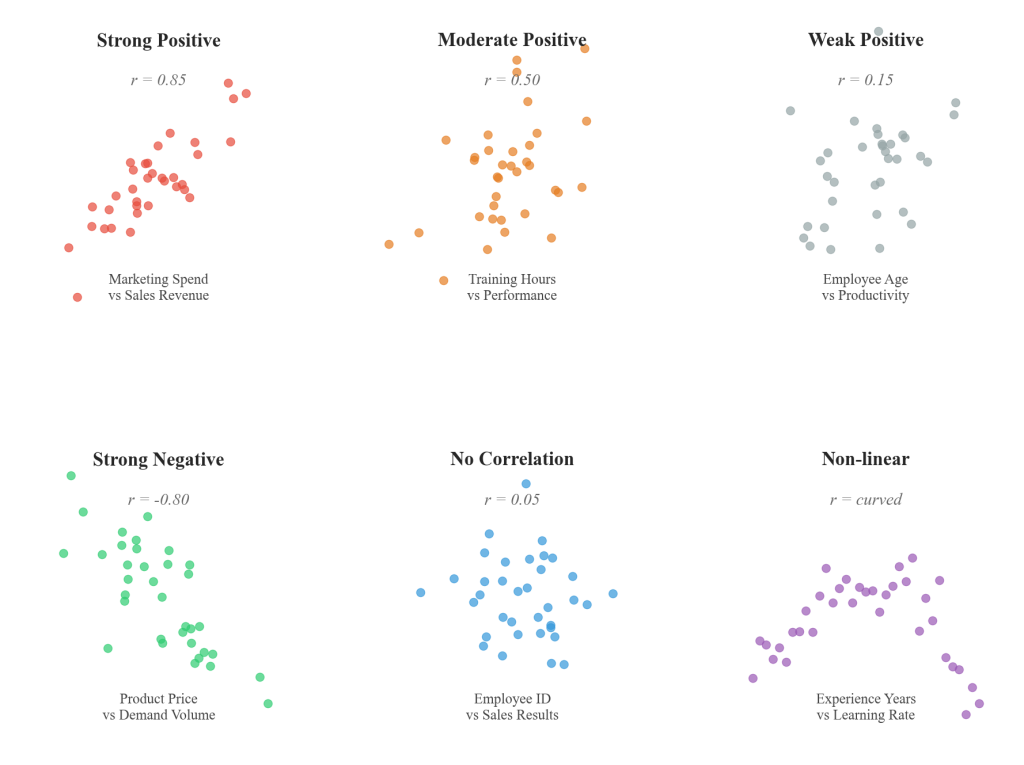
Figure 6.4.2: Six distinct scatterplot examples demonstrating different relationship patterns: strong positive (marketing spend vs sales revenue), moderate positive (training hours vs performance), weak positive (employee age vs productivity), strong negative (product price vs demand volume), no correlation (employee ID vs sales results), and non-linear relationship (experience years vs learning rate). Each pattern includes correlation coefficients and specific business interpretation contexts.
Statistical Software Implementation Methodology
Correlation Analysis Procedures:
Modern statistical software provides comprehensive correlation analysis capabilities through intuitive menu navigation and professional output options that support business decision-making with statistical rigor. Correlation procedures typically access through Regression > Correlation Matrix for comprehensive variable relationship analysis, or through Descriptives > Descriptive Statistics with correlation plot options enabled for integrated descriptive and correlational analysis.
Essential analytical options include Pearson correlations for linear relationships, confidence intervals for population parameter estimation, and significance tests for statistical inference support. Professional correlation analysis incorporates assumption checking through scatterplot options for linearity assessment and density plots for normality evaluation.
Comprehensive correlation output includes correlation coefficients, significance levels, and confidence intervals for all variable pairs, while additional options enable flagging of significant correlations and significance reporting features that highlight statistically meaningful relationships for business interpretation and strategic decision-making applications.
Assumptions and Limitations in Correlation Analysis
Correlation analysis relies on several critical assumptions that must be evaluated to ensure valid interpretation and appropriate business application of relationship findings. Linear relationships represent the primary assumption underlying Pearson correlations, requiring that variables demonstrate consistent patterns of association rather than curved or non-monotonic relationships that correlation coefficients cannot accurately measure. Normality assumptions support significance testing and confidence interval calculation, while homoscedasticity ensures consistent relationship strength across the range of variable values.
Analytical Limitations Framework:
Understanding correlation limitations prevents overinterpretation and supports appropriate business decision-making based on relationship analysis results. Correlation measures only linear associations and may miss important non-linear relationships that require alternative analytical approaches. Outliers can dramatically influence correlation calculations, potentially creating misleading impressions of relationship strength or direction.
Range restriction in business data may artificially reduce correlation estimates, while measurement error in variables can attenuate correlation coefficients and reduce apparent relationship strength below true population values. These limitations require systematic consideration during interpretation and application of correlation findings in professional contexts.
Industry Applications and Cross-Sector Implementation
Correlation analysis finds application across diverse industry contexts where understanding relationships between variables supports strategic decision-making. Retail organizations analyze correlations between advertising spending and sales revenue, weather patterns and product demand, or customer satisfaction scores and repeat purchases to optimize marketing budgets and inventory planning strategies.
Healthcare Applications: Healthcare organizations examine correlations between exercise frequency and health outcomes, medication dosage and patient improvement, or lifestyle factors and disease prevention to guide treatment recommendations and public health initiatives.
Educational Contexts: Educational institutions study correlations between class size and student performance, homework completion and test scores, or attendance rates and graduation success to improve educational programs and resource allocation decisions.
Financial Services: Financial institutions analyze correlations between credit scores and loan default rates, market indicators and stock performance, or economic factors and investment returns to manage risk and guide investment strategies for institutional and individual clients.
Key Concepts Summary
Correlation analysis provides systematic methodology for quantifying relationships between continuous variables, supporting evidence-based decision-making across professional contexts. Pearson correlation coefficients offer standardized measures of linear relationship strength and direction, while scatterplot analysis reveals patterns that numerical measures alone cannot capture.
The critical distinction between correlation and causation prevents analytical overinterpretation while preserving the value of relationship analysis for strategic planning. Statistical software implementation enables comprehensive correlation analysis with assumption checking and professional visualization, supporting rigorous analytical standards in business and research applications.
Understanding correlation assumptions and limitations ensures appropriate interpretation of analytical results, while recognition of cross-industry applications demonstrates the broad utility of relationship analysis methodology for organizational decision-making and strategic planning initiatives.
