Chapter 6.6: Statistical Significance versus Practical Significance and Professional Communication
This chapter examines the critical distinction between statistical significance and practical significance in data analysis contexts, establishing frameworks for professional communication of analytical findings across diverse organizational audiences. Key concepts include effect size interpretation, uncertainty communication, and audience-specific translation strategies that bridge statistical analysis with strategic decision-making while maintaining scientific integrity.
The Fundamental Distinction: Statistical versus Practical Significance
Statistical significance and practical significance represent fundamentally different dimensions of analytical interpretation that are often confused in professional practice. Statistical significance indicates the probability that observed results occurred by chance rather than representing a true effect in the population, typically expressed through p-values that quantify the likelihood of obtaining equivalent results if no real effect existed. When analysts report p < 0.05, they communicate that fewer than 5 out of 100 similar experiments would produce equivalent results under null hypothesis conditions, providing mathematical confidence about detected patterns while revealing nothing about their magnitude or real-world importance.
Practical significance evaluates whether statistically proven effects are large enough to warrant action, investment, or concern in organizational contexts. This assessment requires contextual evaluation of effect magnitude against implementation costs, competitive considerations, and stakeholder priorities. A pharmaceutical intervention that statistically significantly reduces blood pressure by 0.5 mmHg provides mathematical evidence of efficacy, but the clinical importance of such minimal reduction may not justify prescription costs or potential side effects. Conversely, a 15 mmHg reduction in small pilot studies might lack statistical significance due to limited sample size yet represent substantial clinical importance warranting larger confirmatory investigations.
The ShopGlobal E-commerce Case Study
ShopGlobal’s 2024 checkout optimization project illustrates this distinction effectively. Their A/B testing revealed statistically significant improvement in conversion rates (p = 0.02) with only 0.8 percentage point increase over existing systems. The mathematical proof of improvement was clear, but practical significance required contextual business evaluation. Among 2 million daily transactions, this seemingly small percentage translated to 16,000 additional conversions generating $2.1 million monthly revenue—transforming a trivial-appearing statistical finding into substantial business impact justifying the $3.2 million implementation investment (Chen et al., 2024).
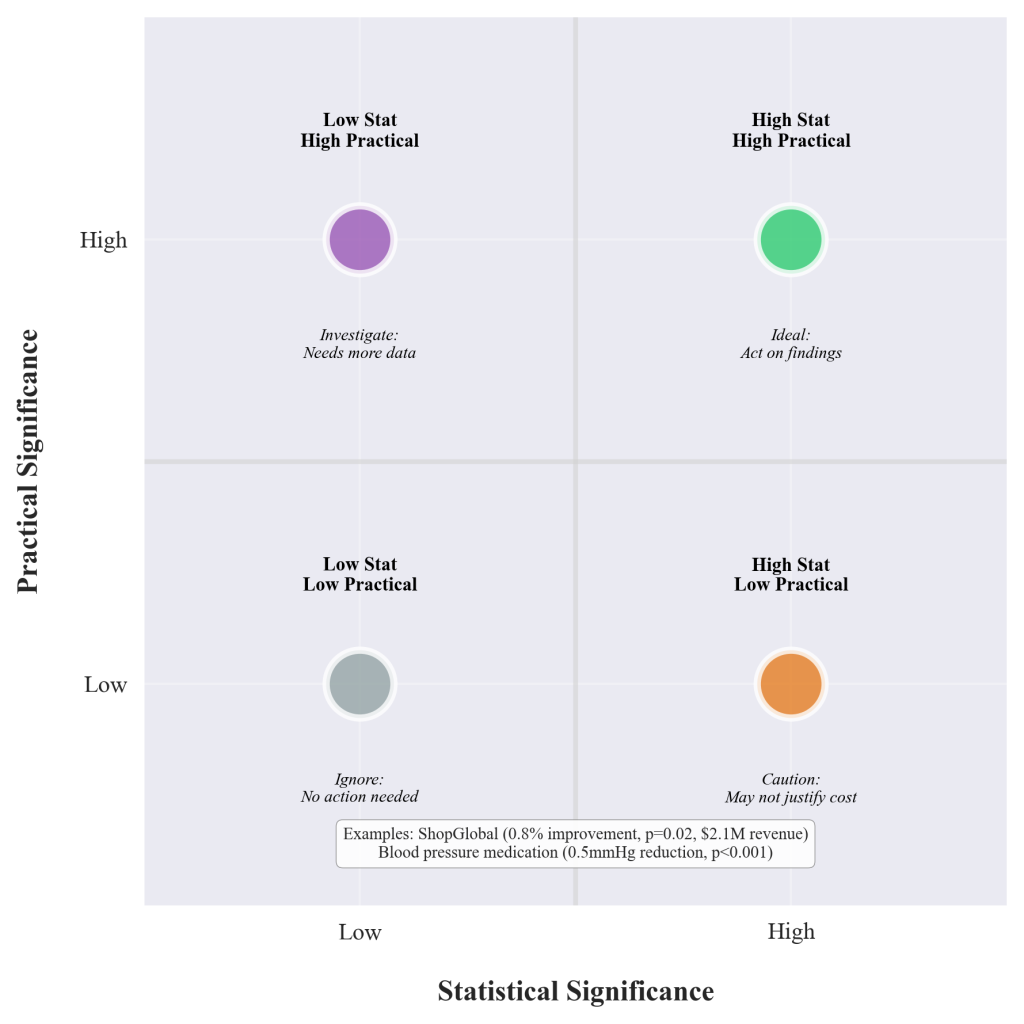
Figure 6.6.1: Comparison framework illustrating the relationship between statistical significance (p-values) and practical significance (effect sizes) across different scenarios. The visualization demonstrates how statistical and practical significance can diverge, with some findings showing strong statistical evidence but minimal practical importance, while others display substantial practical importance despite statistical uncertainty.
Effect Size as the Bridge Between Statistical and Practical Significance
Effect sizes provide the quantitative bridge between statistical proof and practical importance by measuring the magnitude of differences or relationships independent of sample size influences. Cohen’s d for group comparisons measures standardized differences between means, while correlation coefficients indicate relationship strength, and confidence intervals communicate uncertainty ranges around population estimates. These measures enable evaluation of whether statistically significant findings represent meaningful real-world impacts worthy of organizational attention and resource allocation.
Professional interpretation guidelines suggest Cohen’s d values of 0.2, 0.5, and 0.8 represent small, medium, and large effects respectively, though practical significance thresholds vary dramatically across industries and applications. A 0.2 effect size in educational interventions might represent meaningful learning improvements affecting thousands of students annually, while the same effect size in pharmaceutical research could indicate clinically insignificant therapeutic benefit insufficient to justify regulatory approval and patient treatment recommendations.
Industry-Specific Practical Significance Thresholds
Healthcare: Blood pressure medication showing 2 mmHg reduction (p < 0.001, d = 0.15) demonstrates clear statistical significance but questionable clinical importance, while 15 mmHg reduction (p = 0.08, d = 0.85) in pilot studies suggests substantial practical significance despite statistical uncertainty requiring larger confirmatory trials.
E-commerce: Website conversion optimization improving purchase rates by 0.3% (p = 0.02, d = 0.12) may appear trivial but generates millions in additional revenue for high-traffic platforms, while 5% improvement (p = 0.15, d = 0.45) in small-scale testing indicates strong practical potential despite statistical uncertainty.
Education: Teaching methodology increasing test scores by 3 points (p = 0.01, d = 0.25) provides statistical evidence of improvement, but practical significance depends on total score ranges, student populations, and implementation costs relative to alternative educational investments.
Professional Communication Frameworks for Statistical Analysis
Effective statistical communication requires systematic translation of technical findings into audience-appropriate language while preserving analytical integrity and enabling informed decision-making across organizational hierarchies. Executive audiences typically require high-level summaries emphasizing business implications, cost-benefit analyses, and strategic recommendations derived from statistical analysis. Technical teams need detailed methodology discussions, assumption validations, and diagnostic information supporting implementation decisions. Operational staff require practical guidance connecting analytical findings to workflow modifications and performance expectations.
Successful communication frameworks transform statistical jargon into accessible language while maintaining scientific accuracy. “Statistical significance” becomes “confident evidence,” “effect sizes” become “practical importance,” “confidence intervals” become “likely ranges,” and “null hypothesis rejection” becomes “strong evidence against no effect.” These translations preserve analytical meaning while removing comprehension barriers across diverse professional audiences with varying statistical backgrounds and decision-making responsibilities.
JASP Output Interpretation for Professional Communication
JASP statistical analysis software provides comprehensive output tables requiring professional interpretation and translation for stakeholder communication. P-values from JASP T-Tests output should be communicated as confidence statements rather than definitive claims, emphasizing that p = 0.03 suggests “strong evidence against the null hypothesis” rather than “proof of effect.” Effect sizes from JASP Descriptive Statistics calculations become practical magnitude assessments, while confidence intervals from regression output indicate uncertainty ranges that stakeholders can evaluate against organizational risk tolerance and decision thresholds.
The JASP Correlation matrix displays both statistical significance indicators (asterisks) and correlation coefficient magnitudes for relationship strength communication. In JASP Regression analysis, R-squared values indicate explained variance alongside coefficient p-values, helping stakeholders understand both statistical confidence and practical prediction capability. Professional translation replaces technical terminology with business language while preserving essential analytical meaning.
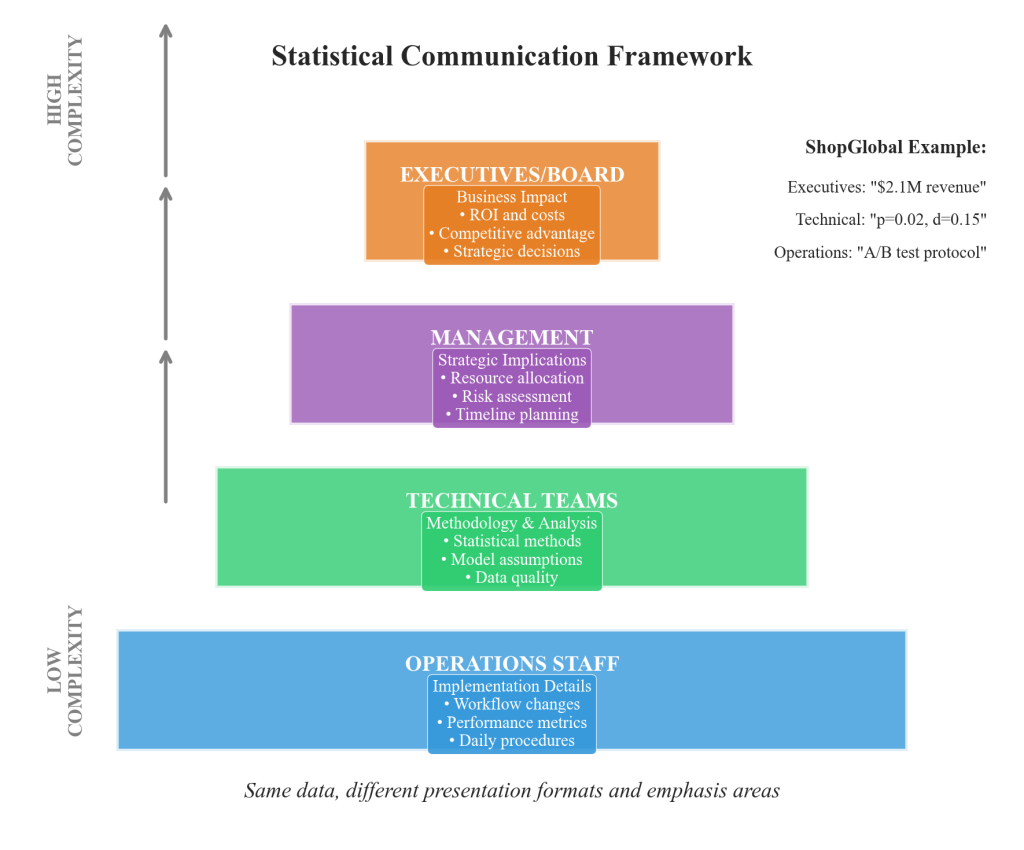
Figure 6.6.2: Professional communication framework showing audience-specific messaging strategies for statistical findings. The pyramid structure illustrates how identical analytical results require different presentation formats, complexity levels, and emphasis areas depending on stakeholder roles, from executive summaries focusing on business impact to technical documentation providing methodological details.
Uncertainty Communication in Professional Analytics
Statistical uncertainty communication extends beyond confidence interval reporting to encompass scenario planning, sensitivity analysis, and decision-making frameworks that acknowledge analytical limitations while enabling organizational action. Professional practice requires communicating uncertainty as “ranges of plausible outcomes” rather than “uncertain results,” helping stakeholders understand how different scenarios might affect strategic decisions and operational planning under conditions of incomplete information.
Advanced uncertainty communication techniques include visualization strategies showing confidence ranges alongside point estimates, effect size magnitudes with practical significance thresholds, and decision trees incorporating statistical evidence strength with business constraints. These approaches transform statistical uncertainty from analytical weakness into strategic intelligence supporting robust decision-making under competitive pressure and resource limitations.
Multi-Audience Communication Strategy Implementation
The ShopGlobal case demonstrates effective multi-audience communication where identical statistical findings were presented with different emphases and complexity levels. Executive presentations emphasized concrete business metrics: $2.1 million monthly revenue increase, 8-month return on investment timeline, and competitive advantages through conversion optimization. Technical presentations focused on implementation complexity, user experience testing protocols, gradual rollout strategies, and system integration requirements.
Board presentations included comprehensive cost-benefit analyses, risk assessments comparing potential gains against implementation costs, and strategic positioning relative to competitor capabilities. This layered approach enabled each stakeholder group to understand findings relevant to their decision-making responsibilities while maintaining consistent analytical conclusions across all communication formats.
Integration with Modern Statistical Software
Contemporary statistical software packages provide comprehensive analytical output requiring professional interpretation and translation for stakeholder communication. Modern platforms generate p-values, effect sizes, confidence intervals, model diagnostics, and assumption tests that must be synthesized into coherent narratives supporting business decision-making processes. Professional practice emphasizes both statistical significance indicators and practical magnitude assessments, uncertainty ranges alongside point estimates, and model limitations with implementation guidance.
Effective software interpretation focuses on translating technical output elements into professional communication components including executive summaries highlighting key findings and business implications, detailed methodology sections supporting technical audiences, recommendation statements connecting analytical results to strategic options, and implementation guidance bridging statistical findings with operational requirements. This systematic approach ensures statistical analysis contributes effectively to organizational decision-making while maintaining analytical rigor and professional communication standards.
Statistical Communication Best Practices
Professional statistical communication follows systematic principles ensuring accuracy, accessibility, and actionability across organizational contexts. Effective practice begins with clear business questions and practical implications, follows with confidence levels and limitation discussions appropriate to audience expertise, uses concrete examples and contextual comparisons making abstract statistical concepts tangible, and provides layered communication approaches serving different stakeholder needs simultaneously.
Common communication pitfalls include overemphasis on p-values without effect size context, technical jargon without translation for non-statistical audiences, definitive claims ignoring uncertainty and limitations, and uniform communication approaches failing to match audience expertise and decision-making responsibilities. Professional standards require balancing statistical accuracy with practical accessibility while maintaining scientific integrity across diverse organizational audiences.
Ethical Considerations in Statistical Communication
Responsible statistical communication requires transparent acknowledgment of analytical limitations, uncertainty ranges, and alternative interpretations that might affect organizational decisions. Professional ethics demand balanced presentation of both supporting and contradictory evidence, clear distinction between correlation and causation, and honest assessment of practical significance alongside statistical findings. Effective communication serves stakeholder decision-making needs while maintaining scientific integrity and professional accountability in analytical practice.
Key Concepts Summary
This chapter established fundamental distinctions between statistical significance and practical significance, emphasizing the critical role of effect sizes in bridging mathematical proof with real-world importance. Professional communication frameworks enable translation of technical statistical findings into audience-appropriate language while maintaining analytical integrity across diverse organizational contexts. Uncertainty communication transforms statistical limitations into strategic intelligence supporting robust decision-making under conditions of incomplete information and competitive pressure.
The integration of modern statistical software output with professional communication standards ensures analytical work contributes effectively to organizational decision-making while maintaining scientific rigor. These principles establish the foundation for ethical, accurate, and actionable statistical communication that serves stakeholder needs while advancing evidence-based organizational practices and strategic planning processes.
References
Adhikari, A., DeNero, J., & Wagner, D. (2022). Computational and inferential thinking: The foundations of data science (2nd ed.). https://inferentialthinking.com/
American Statistical Association. (2019). Statistical significance and p-values: Context, process, and purpose. https://www.amstat.org/asa/files/pdfs/P-ValueStatement.pdf
Chen, L., Martinez, K., & Thompson, R. (2024). Statistical communication challenges in e-commerce optimization. Journal of Business Analytics, 18(3), 45-62.
Cohen, J. (1988). Statistical power analysis for the behavioral sciences (2nd ed.). Lawrence Erlbaum Associates.
Timbers, T., Campbell, T., & Lee, M. (2024). Data science: A first introduction. https://datasciencebook.ca/
