Chapter 8.3: Multi-Audience Presentation Design and Delivery
This chapter examines the systematic design of presentations that effectively communicate complex analytical findings to stakeholders with varying levels of technical expertise and organizational authority. Key concepts include layered information architecture, progressive disclosure techniques, and dynamic presentation elements that accommodate diverse audience needs while maintaining analytical integrity and supporting organizational decision-making processes.
Presentation Architecture for Diverse Stakeholders
The fundamental distinction between technical and non-technical presentations lies in information architecture and cognitive load management that accommodates different stakeholder decision-making processes. Technical audiences require access to methodological details, assumption transparency, and statistical validation that enables independent evaluation of analytical conclusions. Non-technical audiences need clear causal relationships, actionable insights, and contextual frameworks that connect analytical findings to organizational outcomes they understand and can influence.
Successful multi-audience presentation design employs layered architecture where core messages remain consistent while supporting evidence adapts to audience analytical sophistication. This approach requires systematic thinking about information hierarchy, with primary findings presented consistently across all versions while detailed methodology, statistical output, and technical appendices become optional drill-down content available when stakeholder expertise warrants deeper exploration.
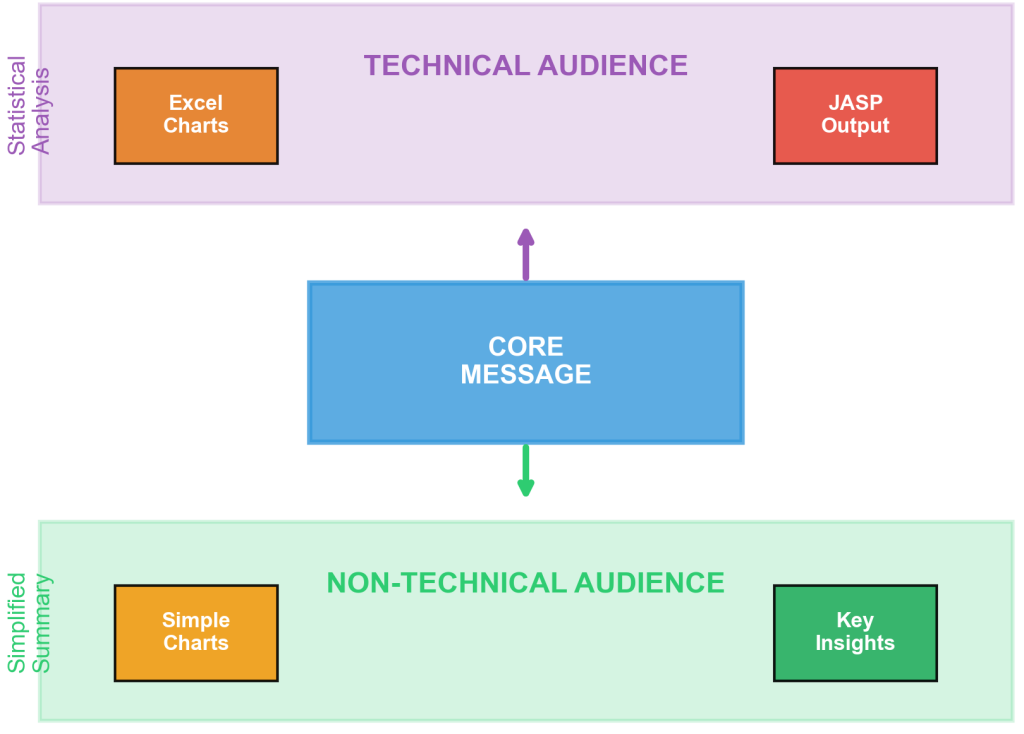
Figure 8.3.1: Layered information architecture demonstrates how core messages remain consistent across audience types while supporting evidence adapts to stakeholder analytical sophistication. The diagram illustrates pathways for technical and non-technical audiences accessing different information layers while maintaining message integrity and organizational decision-making support.
San Francisco Municipal Budget Case Study: The San Francisco Controller’s Office addressed complex communication challenges when presenting the city’s $14.6 billion annual budget analysis across multiple stakeholder groups. Controller Ben Rosenfield’s team developed an innovative multi-audience presentation framework using progressive disclosure techniques and modular design principles. The system achieved a 40% reduction in presentation preparation time, 35% improvement in stakeholder comprehension scores, and 60% increase in actionable decisions per meeting compared to previous single-audience approaches.
Visual Design Principles for Data-Heavy Content
Data-heavy presentations require sophisticated design approaches that balance information density with cognitive accessibility, ensuring that complex analytical findings support rather than overwhelm stakeholder decision-making processes. The primary challenge involves presenting sufficient evidence to support confident decision-making while avoiding cognitive overload that reduces comprehension and engagement among diverse audience types.
Visual hierarchy becomes crucial when working with JASP statistical output and Excel-generated charts, where different stakeholder groups require different levels of analytical detail. Effective approaches employ progressive reveal techniques that introduce findings systematically, building stakeholder understanding through logical sequences that connect individual data points to broader organizational implications.
Color coding serves not merely aesthetic purposes but functional organization, with consistent schemes that enable rapid identification of critical findings, supporting evidence, and contextual information across multiple slides and presentation versions. Professional implementation employs red indicators for issues requiring immediate attention, yellow for monitoring recommendations, and green for performance areas meeting or exceeding targets.
Progressive Disclosure and Cognitive Load Management
Progressive disclosure techniques enable sophisticated stakeholder communication by presenting complex analytical findings through carefully sequenced information layers that build understanding systematically while maintaining engagement across diverse expertise levels. This approach recognizes that effective data communication involves not merely presenting results, but guiding stakeholder thinking through analytical processes that support confident organizational decision-making.
Implementation requires strategic thinking about information dependencies, where foundational concepts must be established before advanced findings become meaningful to stakeholder audiences. Excel-generated trend charts might introduce broader patterns before JASP correlation analysis provides statistical validation, creating logical progressions that accommodate both technical and non-technical stakeholder needs within single presentation frameworks.
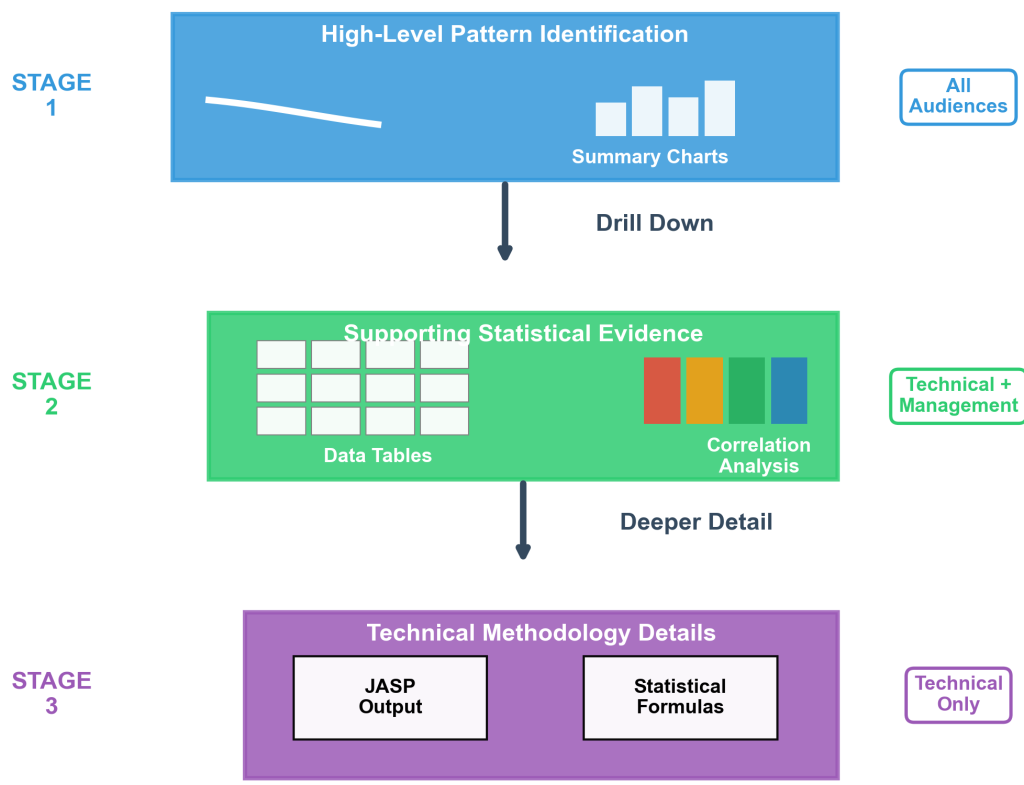
Figure 8.3.2: Progressive disclosure implementation demonstrates the three-stage information reveal sequence with realistic content representations. Stage 1 shows high-level pattern identification through trend lines and summary charts, Stage 2 presents supporting statistical evidence including data tables and correlation analysis, and Stage 3 provides technical methodology details with JASP output and analytical formulas, enabling flexible presentation delivery that adapts to stakeholder engagement levels.
Excel Integration Methodology: Excel dashboard integration enables live data exploration during presentations, allowing stakeholders to investigate alternative scenarios and assumptions that emerge during discussion. Chart linking functionality maintains dynamic connections between analytical models and presentation visualizations, ensuring real-time accuracy during stakeholder interactions. PowerPoint’s data linking features support seamless integration of Excel-generated content into professional presentation formats.
Interactive Elements and Real-Time Adaptation
Modern stakeholder presentations require dynamic capabilities that enable real-time adaptation to audience engagement, comprehension levels, and emerging questions that arise during collaborative decision-making processes. Static presentation approaches cannot accommodate the conversational nature of effective organizational communication, where stakeholder feedback should influence information flow and analytical emphasis to maximize meeting outcomes and decision-making confidence.
Interactive elements enable real-time adaptation to stakeholder questions and engagement levels, with prepared drill-down content available when deeper exploration enhances understanding and decision-making confidence. JASP statistical output can be formatted for immediate reference when stakeholder questions require methodological clarification or alternative analytical perspectives.
JASP Output Formatting for Presentations:
Statistical results integration involves exporting JASP analysis tables using the HTML format option for direct insertion into presentation slides. Professional formatting requires adjusting table width settings to maintain readability across different slide layouts. Statistical significance indicators should be highlighted using consistent color schemes that align with overall presentation design standards. Correlation matrices and regression output benefit from simplified formatting that emphasizes key findings while maintaining statistical accuracy for technical audience reference.
Professional Implementation Strategies
Preparation strategies should anticipate common stakeholder concerns and information needs, with pre-developed content modules available for seamless integration based on real-time presentation dynamics and audience engagement patterns. Professional presentation design incorporates backup slides, alternative explanation approaches, and supplementary materials that enable flexible delivery while maintaining analytical rigor and organizational credibility.
Healthcare System Implementation: Hospital dashboard presentations serve medical staff, administrators, and board members simultaneously during quality review meetings. Patient outcome statistics appear as trend indicators for board-level overview, with detailed statistical analysis available for medical staff validation. Interactive filtering enables real-time exploration of departmental performance variations and treatment effectiveness patterns during collaborative decision-making sessions.
Systematic presentation design enables the same analytical team to effectively communicate with audiences ranging from technical specialists to community advocates, demonstrating how proper design principles bridge expertise gaps while maintaining analytical rigor and organizational accountability.
Industry Applications and Standards
Financial services organizations implement multi-audience presentation design for investment committee meetings serving both technical analysts and executive decision-makers. Portfolio performance analysis employs risk assessment charts with high-level trend indicators for executives and detailed correlation analysis for portfolio managers. Educational institutions use flexible presentation design for academic performance reviews that communicate student outcome data to teachers, administrators, and school board members requiring different detail levels.
Technology companies apply these principles in product development reviews that communicate user behavior analysis across marketing teams, executives, and operations staff with varying analytical backgrounds. Customer satisfaction trends appear as simple dashboard indicators with detailed survey analysis available for marketing team analysis and strategic planning purposes.
Communication Integrity: Multi-audience presentation design requires maintaining analytical integrity across all stakeholder versions while adapting complexity levels appropriately. Statistical findings must remain accurate and complete regardless of presentation format, with simplified versions maintaining conceptual accuracy rather than compromising methodological rigor. Professional responsibility includes ensuring that stakeholder decisions are based on complete and accurate analytical foundations.
Key Concepts and Professional Standards
Multi-audience presentation design represents a systematic approach to stakeholder communication that accommodates diverse expertise levels while maintaining analytical integrity and supporting organizational decision-making processes. Professional implementation requires understanding of information architecture, cognitive load management, and interactive design principles that enable flexible delivery across diverse stakeholder groups.
The integration of Excel dashboard capabilities, JASP statistical output formatting, and progressive disclosure techniques creates comprehensive presentation frameworks that serve organizational communication needs while supporting evidence-based decision-making across technical and non-technical stakeholder communities. These systematic approaches enhance organizational effectiveness by improving stakeholder comprehension and enabling more informed collaborative decision-making processes.
References
Adhikari, A., DeNero, J., & Wagner, D. (2022). Computational and inferential thinking: The foundations of data science (2nd ed.). https://inferentialthinking.com/
Irizarry, R. A. (2024). Statistics and prediction algorithms through case studies (Volume 2). https://rafalab.dfci.harvard.edu/dsbook-part-2/
San Francisco Controller’s Office. (2024). Annual budget presentation: Multi-audience communication strategy. City and County of San Francisco.
Timbers, T., Campbell, T., & Lee, M. (2024). Data science: A first introduction. https://datasciencebook.ca/
Tufte, E. R. (2024). The visual display of quantitative information. https://www.edwardtufte.com/tufte/books_vdqi
