Chapter 8.4: Data Storytelling and Compelling Narratives
This chapter examines the systematic integration of quantitative analysis with narrative communication techniques to enhance stakeholder comprehension and engagement. Key concepts include problem-solution-impact frameworks, emotional engagement principles, and technological implementation strategies that transform analytical findings into compelling organizational communications.
Foundations of Data Storytelling
Data storytelling represents the systematic integration of quantitative analysis with narrative communication techniques designed to enhance stakeholder comprehension and engagement. This approach transcends traditional analytical reporting by embedding statistical findings within structured narratives that engage both cognitive and emotional processing systems simultaneously. The fundamental framework employs problem-solution-impact sequences that mirror natural storytelling patterns while maintaining analytical rigor and evidence-based reasoning essential for organizational decision-making.
Data Storytelling Framework: The systematic application of narrative structure principles to quantitative analysis presentation, employing problem-solution-impact sequences that create stakeholder engagement while preserving analytical integrity and supporting confident organizational decision-making processes.
The framework operates through three distinct phases that guide stakeholder attention and comprehension. The problem phase establishes context and creates narrative tension through relatable challenges that stakeholders recognize from professional or personal experience. Rather than beginning with data, effective narratives start with human situations that create emotional investment before introducing analytical evidence. The solution phase introduces data insights as evidence for systematic approaches to addressing established problems, positioning analytical findings as tools for achieving outcomes stakeholders desire. The impact phase demonstrates how analytical findings enable stakeholder success and organizational advancement, creating motivation for implementation and continued analytical investment.
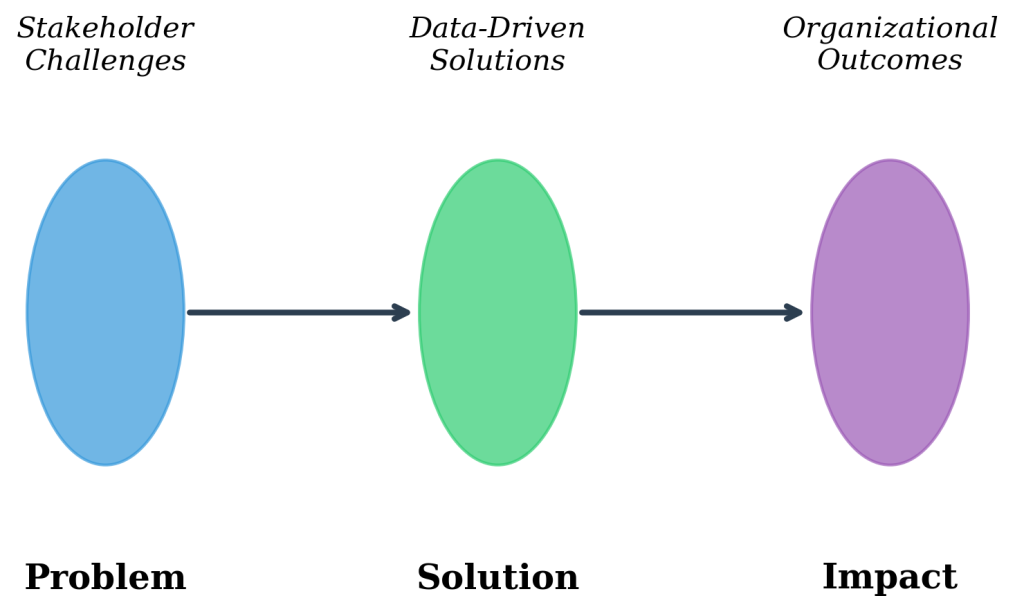
Figure 8.4.1: Problem-solution-impact narrative framework showing the sequential progression from stakeholder problem identification through data-driven solution development to measurable organizational impact. This framework demonstrates how systematic storytelling approaches transform quantitative analysis into actionable organizational communications.
Case Study: California Climate Action Communication Initiative
California’s Governor’s Office of Planning and Research, under Dr. Kate Gordon’s leadership, developed an innovative approach to communicating complex climate science data that demonstrates the practical application of systematic data storytelling principles. The initiative addressed communication challenges surrounding climate action framework presentation to diverse stakeholder groups including policy makers, business leaders, and community advocates.
The analysis contained comprehensive data showing temperature increases of 2.8°F since 1980, projected sea level rise of 1.9 feet by 2100, and economic impacts exceeding $113 billion annually without intervention. Traditional approaches focused on presenting scientific findings through technical reports and statistical summaries that documented climate trends but failed to generate the emotional engagement necessary for policy implementation and public support. Stakeholder research revealed that while audiences acknowledged data credibility, they struggled to connect abstract statistical projections to personal experience and organizational priorities, resulting in limited policy momentum despite overwhelming scientific evidence.
Gordon’s team developed an innovative data storytelling framework employing narrative tension and resolution structures to transform climate data into compelling human stories. Their approach uses problem-solution-impact sequences that begin with relatable community experiences, introduce scientific data as evidence for broader patterns, and conclude with actionable solutions that connect to stakeholder values and capabilities.
The initiative employed audience-specific narrative approaches. For policy makers, narratives focused on economic competitiveness and job creation, featuring stories about renewable energy companies creating 75,000 new California jobs while reducing emissions by 18% since 2016. Business leader communications emphasized innovation opportunities and market advantages, using case studies like Pacific Gas and Electric’s $15 billion clean energy investment generating 25% cost savings while positioning California companies as global leaders in sustainable technology markets. Community presentations employed local impact stories, such as Los Angeles’s cool pavement program reducing neighborhood temperatures by 6°F while creating 200 local construction jobs and saving residents $400 annually in cooling costs.
Implementation results demonstrated measurable communication effectiveness improvements. Policy engagement scores increased 67% compared to traditional technical presentations, with legislative support for climate initiatives rising from 52% to 78% following storytelling-based communications. Business investment in clean technology accelerated 34% within six months of targeted narrative campaigns, while community support for local climate programs improved from 41% to 69% across demographic groups.
Emotional Engagement Techniques with Quantitative Data
Successful data storytelling requires sophisticated integration of quantitative evidence with emotional engagement techniques that respect both analytical integrity and human psychological needs for meaning and connection. The challenge involves presenting statistical findings through narrative approaches that enhance rather than compromise scientific credibility while creating stakeholder investment in analytical conclusions.
Metaphors and analogies serve as bridges between abstract statistical concepts and familiar stakeholder experiences, enabling intuitive understanding of complex analytical relationships without requiring technical expertise. When discussing data trend analysis, comparing patterns to familiar growth cycles or seasonal variations helps stakeholders grasp statistical concepts through existing mental models that support confident interpretation and decision-making. These cognitive bridges transform abstract quantitative relationships into accessible conceptual frameworks that stakeholders can readily understand and apply.
Personalization techniques connect aggregate data patterns to individual stakeholder concerns and opportunities, demonstrating how systematic trends influence specific organizational contexts and personal professional outcomes. Rather than discussing population-level statistics in isolation, effective narratives show how broader patterns manifest in stakeholder-relevant scenarios that motivate engagement and implementation commitment. This approach transforms statistical abstractions into concrete professional implications that stakeholders can evaluate and act upon.
Building Narrative Tension and Resolution
Compelling data narratives employ dramatic structure principles that create intellectual and emotional investment through systematic revelation of analytical insights. The process involves strategic information sequencing that builds stakeholder curiosity and engagement while maintaining logical progression toward evidence-based conclusions that support organizational decision-making.
Tension development introduces analytical questions or challenges that stakeholders recognize as important but cannot resolve through existing knowledge or intuition alone. This approach positions data analysis as detective work that reveals hidden patterns or validates stakeholder hypotheses about organizational challenges and opportunities, creating intellectual investment in analytical findings. The technique transforms passive data consumption into active intellectual engagement that motivates stakeholder participation in analytical processes.
Resolution sequences demonstrate how data insights provide solutions to established challenges while opening new possibilities for organizational growth and improvement. Rather than simply presenting conclusions, effective narratives show how analytical findings enable stakeholder success and organizational advancement, creating motivation for implementation and continued analytical investment. This approach ensures that data storytelling culminates in actionable insights that stakeholders can implement within their organizational contexts.
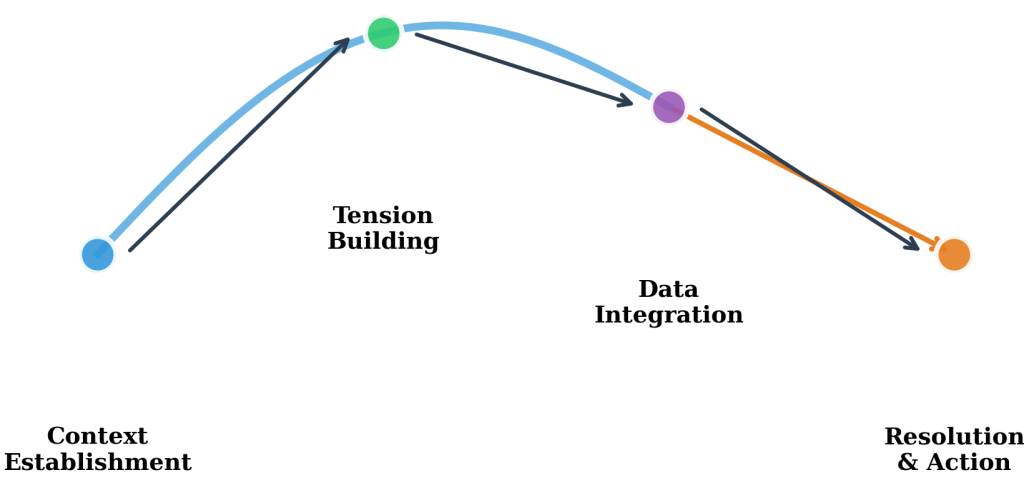
Figure 8.4.2: Narrative tension development progression showing the systematic sequence from context establishment through tension building, data integration, and final resolution. This workflow demonstrates how strategic information sequencing creates stakeholder engagement while maintaining analytical integrity throughout the storytelling process.
Technological Integration for Story Enhancement
Excel Story Dashboard Methodology
Excel provides foundational storytelling capabilities through advanced charting features, interactive elements, and familiar interfaces that enable stakeholder engagement without requiring specialized software knowledge. Excel’s storytelling capabilities include conditional formatting that highlights narrative elements, interactive charts that enable stakeholder exploration of data relationships, and dashboard layouts that guide attention through logical narrative sequences.
Modern data storytelling requires technological integration that enables dynamic narrative presentation while maintaining analytical accuracy and stakeholder accessibility. Excel dashboard creation for storytelling involves the systematic application of visualization principles that support narrative flow and stakeholder comprehension. The Excel Data tab provides access to pivot table functionality that enables dynamic story element creation, while chart tools support the development of visualizations that enhance narrative progression and stakeholder engagement.
Excel Narrative Dashboard Development:
1. Data preparation involves organizing source information to support story sequence development
2. Pivot table creation enables dynamic content generation that adapts to narrative requirements
3. Chart development applies visualization principles that enhance narrative flow and stakeholder comprehension
4. Dashboard layout design guides stakeholder attention through systematic narrative progression
5. Interactive element integration enables stakeholder exploration while maintaining story coherence
KNIME Automated Narrative Systems
KNIME automated narrative generation transforms manual storytelling approaches into scalable communication systems that adapt to changing data while preserving narrative structure and stakeholder engagement principles. Automated workflows generate updated story dashboards as new data becomes available, ensuring that narrative communications remain current and relevant for ongoing organizational decision-making and strategic planning processes.
KNIME workflow development for automated storytelling involves the systematic integration of data processing nodes with narrative template generation capabilities. The KNIME interface enables the creation of workflows that combine statistical analysis with narrative content generation, producing stakeholder-ready communications that maintain storytelling coherence while adapting to changing organizational data requirements.
KNIME Narrative Automation Workflow Methodology:
KNIME workflow development for automated storytelling involves systematic integration of data processing nodes with narrative template generation capabilities. Data input nodes enable automated content generation from changing organizational datasets. Statistical analysis components provide quantitative foundations for narrative development. Template processing nodes integrate analytical findings with narrative structure frameworks, while output generation creates stakeholder-ready communications that maintain storytelling quality and coherence.
Professional Implementation Frameworks
Systematic data storytelling implementation requires structured approaches that balance narrative engagement with analytical credibility. Professional frameworks emphasize audience analysis, narrative structure planning, and systematic quality assurance that ensures storytelling enhances rather than compromises data communication effectiveness.
Audience analysis identifies stakeholder priorities, communication preferences, and decision-making contexts that influence narrative design choices. This analysis guides metaphor selection, tension development strategies, and resolution approaches that resonate with specific stakeholder groups while maintaining analytical integrity across different presentation contexts. The process ensures that storytelling techniques serve stakeholder needs rather than creating barriers to data comprehension and organizational decision-making.
Quality assurance frameworks verify that narrative elements support rather than distract from analytical conclusions, ensuring that storytelling techniques enhance stakeholder comprehension without introducing bias or misrepresentation of quantitative findings. These frameworks maintain professional standards while enabling creative communication approaches that improve organizational data utilization and decision-making effectiveness.
Ethical Considerations in Data Storytelling
Data storytelling carries ethical responsibilities regarding accurate representation of quantitative findings and honest communication of analytical limitations. Professional implementation requires systematic attention to narrative accuracy, stakeholder transparency, and organizational integrity that ensures storytelling serves rather than manipulates stakeholder decision-making processes.
Key Concepts Summary
This chapter examined the systematic integration of quantitative analysis with narrative communication techniques that enhance stakeholder comprehension and organizational engagement. The problem-solution-impact framework provides structured approaches to transforming analytical findings into compelling stakeholder communications while maintaining scientific rigor and supporting confident decision-making.
Emotional engagement techniques, including metaphorical bridge construction and personalization strategies, enable stakeholders to connect abstract statistical concepts to familiar experiences and professional contexts. Narrative tension and resolution sequences create intellectual investment in analytical findings while demonstrating practical applications that motivate implementation and organizational change.
Technological integration through Excel and KNIME enables scalable data storytelling approaches that maintain narrative quality while adapting to changing organizational requirements. Professional implementation frameworks ensure that storytelling techniques enhance rather than compromise analytical communication effectiveness, supporting organizational data utilization and strategic decision-making processes.
References
Adhikari, A., DeNero, J., & Wagner, D. (2022). Computational and inferential thinking: The foundations of data science (2nd ed.). University of California, Berkeley. https://inferentialthinking.com/
California Governor’s Office of Planning and Research. (2024). California climate action framework: Communication strategy and stakeholder engagement. State of California.
Irizarry, R. A. (2024). Introduction to data science: Data wrangling and visualization with R. Harvard T.H. Chan School of Public Health. https://rafalab.dfci.harvard.edu/dsbook-part-1/
KNIME AG. (2024). KNIME Analytics Platform [Computer software]. https://www.knime.com/
Microsoft Corporation. (2024). Create a dashboard in Excel. https://support.microsoft.com/en-us/office/create-a-dashboard-in-excel-7021b7ce-9b31-4d40-af05-c3d4782ac299
Timbers, T., Campbell, T., & Lee, M. (2024). Data science: A first introduction. University of British Columbia. https://datasciencebook.ca/
