Chapter 1.4 The Data Science Lifecycle (CRISP-DM)
This chapter examines the Cross-Industry Standard Process for Data Mining (CRISP-DM) methodology as the systematic framework for conducting successful data science projects. Key concepts include the six-phase lifecycle structure, iterative project management principles, and adaptation patterns across different industry contexts. The analysis establishes foundational understanding of how systematic methodology transforms complex organizational challenges into actionable data science solutions.
Systematic Data Science: The Telecommunications Churn Challenge
Telecommunications companies face a persistent challenge that affects their entire business model: customer churn. Subscriber cancellations result in immediate revenue loss and elimination of long-term customer relationship value that can span years or decades. Industry research demonstrates that acquiring new customers costs five to seven times more than retaining existing ones, making churn reduction a critical business priority worth millions of dollars annually for major providers.
A major telecommunications provider addressing this challenge systematically would not immediately implement data analysis or build predictive models. Instead, successful organizations follow a proven methodology that ensures technical work addresses genuine business needs and creates measurable organizational value. This systematic approach—the Cross-Industry Standard Process for Data Mining (CRISP-DM)—transforms complex business challenges into actionable data science solutions through careful attention to business context, data quality, and implementation requirements.
CRISP-DM Framework Implementation: A Telecommunications Case Analysis
A data science team tasked with reducing customer churn follows a proven six-phase methodology that ensures technical work aligns with business needs and organizational capabilities. This systematic approach typically requires 12-18 months from initial problem identification to full deployment, resulting in sustainable solutions that create measurable business value rather than technically sophisticated but operationally irrelevant models.
The project begins with extensive stakeholder interviews involving customer service representatives, marketing managers, network engineers, billing specialists, and customers themselves. Understanding that churn results from complex interactions between service quality, pricing, customer experience, and competitive offerings, the team translates this business complexity into a data science framework capable of generating timely, actionable predictions.
Data exploration reveals the challenge’s true scope: integrating customer service records with network performance data, billing information, usage patterns, demographic data, and competitive intelligence. Traditional reporting approaches have provided historical insights but lack the predictive capability required for proactive customer retention efforts with the speed and accuracy demanded by competitive markets.
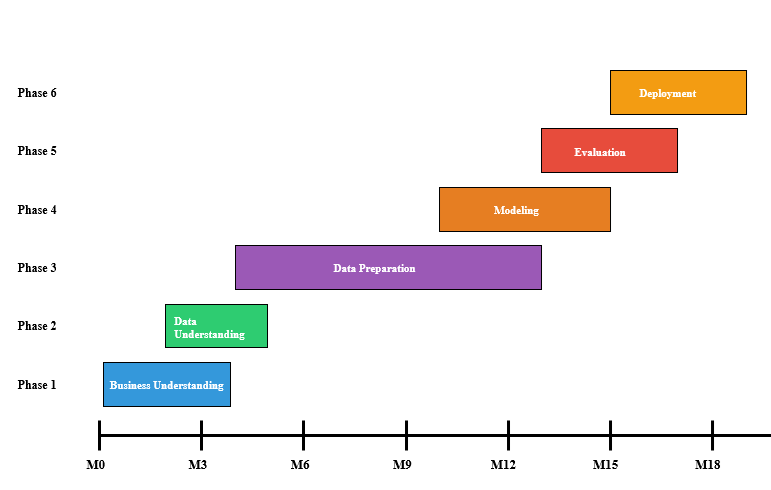
Figure 1.4.1: CRISP-DM project timeline showing the telecommunications churn project phases over 18 months. The diagram illustrates overlapping phases and iterative feedback loops: Business Understanding (Months 1-3), Data Understanding (Months 2-4), Data Preparation (Months 4-12), Modeling (Months 10-14), Evaluation (Months 13-16), and Deployment (Months 15-18). The overlapping structure demonstrates the methodology’s iterative nature rather than linear progression.
The iterative nature of the approach proves crucial for project success. Initial models might demonstrate promise but reveal gaps in capturing customer sentiment data. This discovery leads the team back to data collection, incorporating social media mentions, support ticket sentiment analysis, and survey responses. When model validation indicates lower accuracy for certain customer segments, they revisit their business understanding to ensure their solution addresses all customer types rather than just majority populations.
The final deployed system automatically identifies customers at high risk of churning within 30-day periods, triggering personalized retention campaigns that include targeted offers, proactive customer service outreach, or service quality improvements. The system continues learning from new data through monthly model updates, ensuring performance remains optimal as customer behavior and market conditions evolve.
Systematic Approach Value Creation
This systematic approach demonstrates why methodology matters in data science practice. Without structured frameworks, teams might build technically sophisticated models that fail to address real business needs, ignore crucial data sources, or prove impossible to implement within existing business processes. The CRISP-DM methodology ensures solutions create genuine value for customers, employees, and organizations through systematic attention to business context, technical feasibility, and operational integration.
CRISP-DM: The Foundation of Systematic Data Science
The Cross-Industry Standard Process for Data Mining (CRISP-DM) emerged in the late 1990s from collaboration between industry leaders who recognized that successful data science projects require more than technical expertise—they need systematic methodology that ensures business value and implementation success. Contemporary surveys consistently show CRISP-DM as the preferred methodology among data science practitioners, with widespread adoption across industries and organizational contexts.
CRISP-DM addresses a fundamental challenge in data science: the gap between technical possibility and business reality. While machine learning algorithms and statistical methods provide powerful tools for extracting insights from data, translating those insights into organizational value requires systematic attention to business context, data quality, implementation constraints, and ongoing maintenance requirements.
The methodology recognizes that data science projects are inherently uncertain and iterative. Unlike traditional software development where requirements can be specified comprehensively upfront, data science projects involve discovery processes where initial findings reshape project scope, reveal new data needs, and suggest alternative approaches. CRISP-DM’s structure accommodates this uncertainty while maintaining project momentum and stakeholder alignment.
The Business Value of Systematic Methodology
The difference between ad-hoc analysis and systematic data science becomes apparent when examining project outcomes. An analyst might discover interesting patterns in customer data and build a predictive model that achieves impressive accuracy in testing environments. However, without systematic methodology, this work might fail to address actual business needs, rely on data unavailable in production environments, or prove impossible to integrate into existing operational processes.
CRISP-DM prevents these failures by ensuring technical work remains grounded in business reality throughout the project lifecycle. Each phase includes specific deliverables and decision points that maintain alignment between analytical work and organizational objectives, increasing the likelihood that projects deliver measurable business value rather than merely technical achievements.
The Six Phases of CRISP-DM
CRISP-DM organizes data science work into six distinct but interconnected phases, each with specific objectives, activities, and deliverables. Understanding these phases helps data scientists maintain project focus, communicate progress effectively, and ensure that technical work translates into business value through systematic attention to both technical and organizational requirements.
Phase 1: Business Understanding (15-25% of project time)
The foundation of successful data science projects lies in clearly understanding the business problem and translating it into analytical objectives addressable through data science methods. This phase involves extensive stakeholder engagement to define success criteria, identify constraints, and establish project scope with measurable outcomes and realistic timelines.
In the telecommunications churn example, this phase involves months of interviews with customer service staff, marketing teams, network engineers, and customers to understand complex factors contributing to churn. The team discovers that while reducing churn rates represents the stated goal, stakeholders have different perspectives on acceptable trade-offs between identifying all at-risk customers and avoiding false alarms that could overwhelm retention resources with unnecessary outreach.
Business Understanding Key Activities
Stakeholder analysis identifies all parties affected by the project and their specific needs. Business objective definition specifies measurable success criteria with timeline constraints. Constraint identification covers budget, timeline, regulatory, and technical limitations. Risk assessment examines potential project challenges and mitigation strategies. The phase concludes with a project charter that aligns all stakeholders on objectives, success criteria, and resource commitments.
Phase 2: Data Understanding (10-20% of project time)
This phase focuses on collecting initial data and gaining familiarity with its characteristics, quality, and potential for addressing business objectives identified in Phase 1. Data understanding involves both technical assessment of data properties and subject matter expert evaluation of data relevance and reliability for the specific business context.
For the telecommunications example, this phase reveals both opportunities and challenges in available data sources. Customer service systems provide rich interaction data, but customer sentiment information might be fragmented across call logs, chat transcripts, and social media platforms. Network performance data offers insights into service quality issues, but with varying granularity across different geographic regions. Understanding these data characteristics proves crucial for realistic project planning and model design.
Data Understanding Essential Activities
Data collection from all potentially relevant sources establishes the information foundation. Data description covers volume, format, and update frequency characteristics. Data exploration uses statistical summaries and visualizations to reveal patterns and anomalies. Data quality assessment identifies missing values, inconsistencies, and reliability concerns. This phase often reveals needs for additional data sources or modifications to business objectives based on data availability constraints.
Phase 3: Data Preparation (40-60% of project time)
Widely recognized as the most time-consuming phase of data science projects, data preparation involves transforming raw data into analysis-ready datasets. This includes cleaning inconsistencies, handling missing values, integrating multiple data sources, and creating features that capture relevant patterns for modeling while maintaining data integrity and business meaning.
The telecommunications churn team spends over half their project time in this phase, developing approaches for integrating customer data across multiple systems, creating temporal features that capture trends in customer behavior and service usage, and combining disparate data sources while maintaining customer privacy protections. Their preparation work includes creating derived variables such as “service satisfaction trend” and “competitive pressure index” that prove crucial for model performance.
Data Preparation Critical Activities
Data cleaning addresses quality issues including missing values, outliers, and inconsistencies. Data integration combines multiple sources while resolving inconsistencies in format, scale, and definitions. Data transformation creates analysis-appropriate formats and scales for modeling techniques. Feature engineering develops variables that capture relevant patterns for the business problem. This phase requires close collaboration between data scientists and domain experts to ensure preparation decisions preserve meaningful information.
Phase 4: Modeling (10-20% of project time)
The modeling phase applies analytical techniques to prepared data to address business objectives defined in Phase 1. This involves selecting appropriate algorithms, training models, tuning parameters, and validating performance using statistical methods appropriate for the problem type and data characteristics.
The telecommunications team’s modeling work involves comparing multiple approaches including logistic regression for interpretability, random forests for handling complex customer behavior interactions, and gradient boosting for predictive performance. They ultimately deploy an ensemble approach that balances accuracy with business interpretability, ensuring that retention specialists can understand and trust the model’s recommendations.
Modeling Key Activities
Modeling technique selection based on problem type and data characteristics guides algorithm choice. Parameter tuning optimizes model performance through systematic testing. Model training uses appropriate validation strategies to ensure generalization. Performance assessment employs metrics aligned with business objectives rather than purely technical measures. The iterative nature of modeling often reveals needs for additional data preparation or feature engineering.
Phase 5: Evaluation (5-15% of project time)
Evaluation involves comprehensive assessment of models and overall project results against business objectives established in Phase 1. This extends beyond technical performance metrics to consider implementation feasibility, stakeholder acceptance, and alignment with organizational constraints and values.
The telecommunications team’s evaluation might reveal that while their model achieves strong predictive accuracy, initial retention workflows create bottlenecks that prevent timely customer outreach. This could lead to workflow redesign and additional staff training before full deployment. Their evaluation might also identify potential differences in model performance across customer segments, leading to refinement strategies ensuring fair treatment across all customer groups.
Evaluation Essential Activities
Model assessment uses business-relevant metrics rather than purely technical measures. Process review examines the overall project approach for completeness and rigor. Deployment feasibility analysis considers technical and organizational constraints. Stakeholder validation ensures results meet user needs and expectations. This phase often identifies needs for additional modeling work or business objective refinement.
Phase 6: Deployment (5-15% of project time)
Deployment transforms analytical results into operational systems that create ongoing business value. This involves technical implementation, user training, monitoring system design, and maintenance planning to ensure continued effectiveness over time as business conditions and data patterns evolve.
The telecommunications team’s deployment involves integrating predictions into existing customer relationship management systems, training retention specialists on new protocols, establishing monitoring dashboards to track model performance and retention campaign effectiveness, and creating feedback mechanisms for continuous improvement. Their deployment strategy ensures the system enhances rather than disrupts existing customer service workflows.
Deployment Critical Activities
Implementation planning covers technical and organizational requirements for system integration. System integration ensures seamless operation within existing infrastructure. User training and change management support successful adoption across affected organizational units. Monitoring system establishment tracks performance and identifies maintenance needs. Successful deployment requires ongoing commitment to system maintenance and continuous improvement.
The Iterative Nature of CRISP-DM
One of CRISP-DM’s most important characteristics is its recognition that data science projects are inherently iterative rather than linear. Unlike traditional project management approaches where phases occur sequentially, CRISP-DM anticipates frequent movement between phases as new insights reshape project understanding and approach.
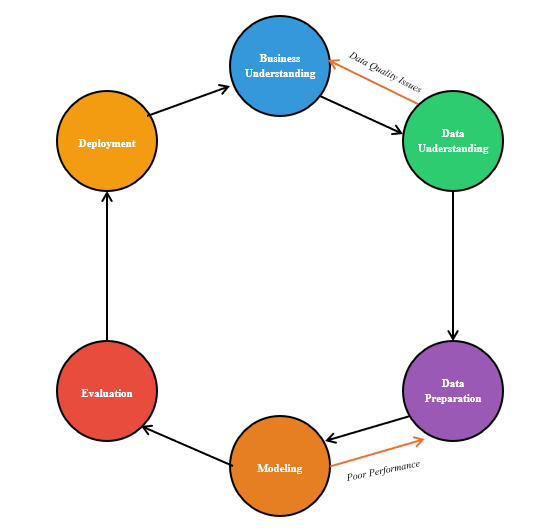
Figure 1.4.2: CRISP-DM iteration patterns showing common feedback loops between phases. The flowchart illustrates decision points and iteration triggers: Data Understanding revealing quality issues leads back to Business Understanding for scope revision; Modeling showing poor performance returns to Data Preparation for feature engineering; Evaluation identifying deployment challenges returns to Business Understanding for requirement adjustment; and Deployment feedback revealing user needs returns to Modeling for algorithm improvements.
Common Iteration Patterns
Data understanding often reveals that initial business objectives are too broad, too narrow, or technically infeasible given available data sources. This leads to business understanding refinement and revised project scope. A telecommunications churn team might experience this when initial data exploration reveals that customer sentiment information is too sparse to support their original modeling approach, requiring business objective modification and additional data source identification.
Modeling work frequently identifies needs for additional data preparation, whether to address quality issues that become apparent during analysis or to create new features that capture patterns revealed through initial modeling attempts. The iterative relationship between modeling and data preparation is particularly strong, with most projects cycling between these phases multiple times as analysts discover new data quality issues or identify opportunities for feature improvement.
Evaluation results often prompt return to earlier phases when models don’t meet performance requirements, deployment constraints prove more challenging than anticipated, or stakeholder feedback reveals misalignment with user needs. Rather than viewing this as project failure, CRISP-DM treats iteration as a natural part of the discovery process that ultimately leads to better solutions.
Managing Iteration Effectively
Successful iteration requires careful project management to maintain momentum while accommodating necessary changes in direction. This involves setting realistic expectations with stakeholders about the iterative nature of data science work, establishing decision criteria for when to iterate versus when to proceed, and maintaining clear documentation of decisions and rationale to prevent endless cycling between phases.
Time-boxing iterations helps prevent projects from becoming trapped in perfectionism cycles. Setting specific timeframes for each phase and establishing “good enough” criteria helps teams make progress while acknowledging that iteration provides opportunities for refinement. A telecommunications churn team might use monthly stakeholder reviews to assess progress and make iteration decisions, balancing thoroughness with project momentum.
CRISP-DM in Different Industry Contexts
While CRISP-DM provides a universal framework, its implementation varies significantly across industries based on regulatory requirements, data characteristics, and organizational constraints. Understanding these variations helps practitioners adapt the methodology to their specific contexts while maintaining its core benefits.
Highly Regulated Industries
In healthcare, pharmaceuticals, and financial services, regulatory requirements significantly extend the evaluation and deployment phases. Documentation requirements are extensive, validation standards are stringent, and deployment involves regulatory approval processes that can take months or years. Healthcare organizations implementing predictive models must navigate HIPAA compliance, clinical workflow integration, and outcome validation requirements that can significantly extend project timelines while ensuring patient safety and regulatory compliance.
Regulatory Adaptation Example
A pharmaceutical company developing predictive models for clinical trial optimization must document every modeling decision, validate results through independent statistical review, and demonstrate compliance with FDA guidelines for software as medical devices. Their CRISP-DM implementation might require 36 months instead of 18, with extensive documentation and validation requirements that ensure patient safety while achieving business objectives.
Technology and E-commerce
Technology companies often compress CRISP-DM timelines and emphasize rapid iteration through phases. A/B testing frameworks enable continuous evaluation and deployment cycles, while automated model training and deployment pipelines accelerate the modeling and deployment phases. Companies like Netflix and Amazon cycle through CRISP-DM phases continuously, with some models being retrained and redeployed daily based on new user behavior data.
Manufacturing and Industrial Applications
Manufacturing contexts often involve extensive data preparation phases due to sensor data complexity and the need for real-time processing capabilities. Deployment requires integration with industrial control systems and safety protocols, while evaluation must consider operational constraints like maintenance windows and production schedules that cannot be disrupted without significant business impact.
Beyond CRISP-DM: Alternative and Complementary Methodologies
While CRISP-DM remains one of the most widely adopted methodologies, several alternatives and complementary approaches have emerged to address specific limitations or industry needs. Understanding these alternatives helps practitioners choose the most appropriate framework for their contexts and understand how CRISP-DM relates to other project management approaches.
Agile and Scrum for Data Science
Agile methodologies adapt software development practices for data science contexts, emphasizing shorter iteration cycles, continuous stakeholder feedback, and adaptive planning. These approaches work particularly well for exploratory projects where business objectives evolve rapidly based on analytical findings, complementing CRISP-DM’s structured approach with more flexible iteration management.
Team Data Science Process (TDSP)
Microsoft’s TDSP provides a more prescriptive framework than CRISP-DM, with detailed templates, checklists, and tool recommendations. TDSP emphasizes collaborative workflows and standardized deliverables, making it particularly suitable for large organizations seeking to standardize data science practices across multiple teams while maintaining the systematic approach that CRISP-DM provides.
Modern MLOps and Automated Machine Learning
Contemporary MLOps practices extend CRISP-DM by emphasizing automated testing, version control, and continuous monitoring throughout the model lifecycle. These approaches are particularly important for organizations deploying multiple models in production environments where manual monitoring becomes impractical, representing an evolution of CRISP-DM deployment practices for modern scale and complexity.
Methodology Evolution and Integration
Modern data science practice increasingly integrates CRISP-DM with agile methodologies, MLOps practices, and automated machine learning workflows. This integration maintains CRISP-DM’s systematic approach to business understanding and project planning while incorporating contemporary practices for rapid iteration, automated testing, and scalable deployment. Understanding these complementary approaches helps practitioners adapt CRISP-DM for modern organizational contexts and technological capabilities.
Foundation for Data Science Practice
Understanding CRISP-DM provides the conceptual foundation for seeing how individual techniques and tools fit into larger project contexts. Rather than learning analytical methods as isolated skills, practitioners understand how they support different phases of systematic data science methodology. Excel serves primarily in data understanding and preparation phases, supporting dataset exploration and quality improvement. Statistical analysis tools support modeling and evaluation work, providing capabilities for testing hypotheses and validating model performance. Workflow automation tools enable deployment and monitoring, supporting reproducible processes that can be maintained and updated over time.
This systematic approach prepares practitioners for real-world projects where technical competence must be combined with project management and business understanding. The telecommunications churn example demonstrates that successful data science requires more than analytical skills—it demands systematic thinking, stakeholder engagement, and iterative problem-solving. These meta-skills distinguish professional data scientists from technical analysts and are developed through understanding and practicing proven methodologies like CRISP-DM.
Contemporary data science practice requires practitioners who understand both the technical capabilities of modern analytical tools and the systematic methodology necessary to translate those capabilities into organizational value. CRISP-DM provides this systematic foundation while remaining flexible enough to accommodate different organizational contexts, industry requirements, and technological capabilities.
References
Adhikari, A., DeNero, J., & Wagner, D. (2022). Computational and inferential thinking: The foundations of data science (2nd ed.). https://inferentialthinking.com/
Irizarry, R. A. (2019). Introduction to data science: Data analysis and prediction algorithms with R. https://rafalab.dfci.harvard.edu/dsbook/
Mariscal, G., Marbán, Ó., & Fernández, C. (2010). A survey of data mining and knowledge discovery process models and methodologies. The Knowledge Engineering Review, 25(2), 137-166.
Schröer, C., Kruse, F., & Gómez, J. M. (2021). A systematic literature review on applying CRISP-DM process model. Procedia Computer Science, 181, 526-534.
Timbers, T., Campbell, T., & Lee, M. (2024). Data science: A first introduction. https://datasciencebook.ca/
Wirth, R., & Hipp, J. (2000). CRISP-DM: Towards a standard process model for data mining. Proceedings of the 4th International Conference on the Practical Applications of Knowledge Discovery and Data Mining, 29-39.
