Chapter 6.2: Introduction to Inferential Statistics and Probability Foundations
This chapter examines the fundamental transition from descriptive to inferential statistics, establishing probability foundations that enable business decision-making under uncertainty. Key concepts include sampling distributions, the Central Limit Theorem, normal distribution properties, and the mathematical frameworks that support evidence-based organizational strategy development.
The Descriptive-Inferential Statistics Distinction
The fundamental distinction between descriptive and inferential statistics represents the most important conceptual advance in data science, transforming analysis from documenting what happened to predicting what will happen. Descriptive statistics summarize characteristics of observed data using measures like means and standard deviations. While essential for understanding current conditions, descriptive analysis cannot answer questions about broader populations, future outcomes, or the reliability of observed patterns.
Inferential statistics enables drawing conclusions about populations based on sample data while quantifying uncertainty appropriately for business planning. When organizations analyze patterns from test samples, they use inferential methods to predict behavior across entire populations. This leap from sample to population requires probability theory that accounts for sampling variation and enables confidence statements about business outcomes.
The mathematical foundation ensures that executives can make strategic decisions with quantified confidence levels rather than intuitive guesswork. This transformation from descriptive reporting to inferential prediction represents the evolution from data documentation to evidence-based decision-making under uncertainty.
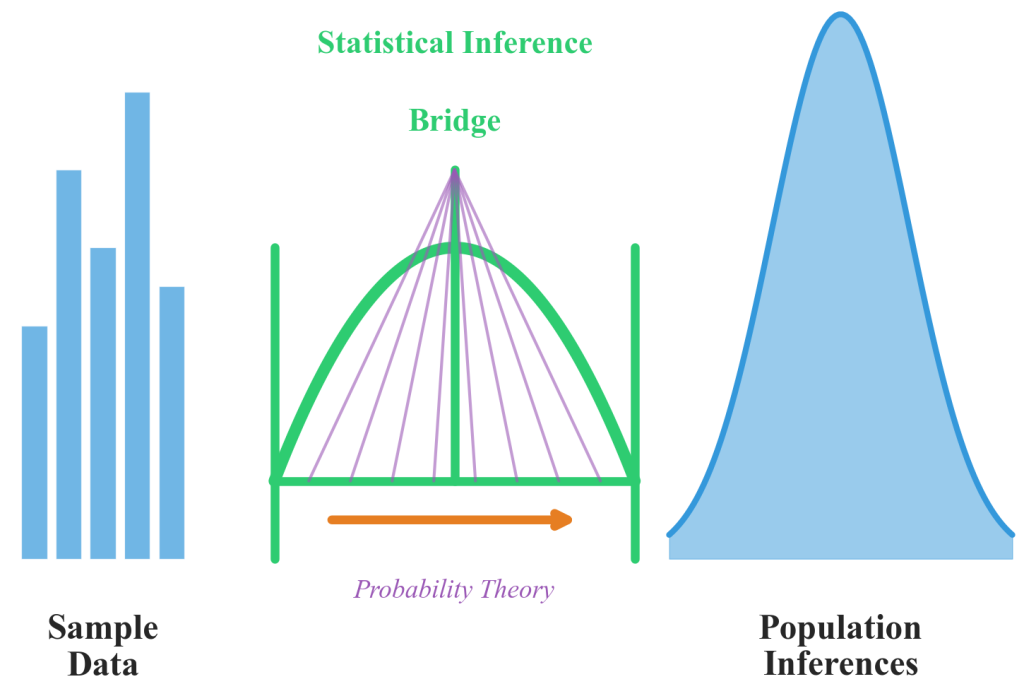
Figure 6.2.1: The statistical inference bridge connecting sample observations to population conclusions. This conceptual framework illustrates how probability distributions and confidence intervals enable the transition from descriptive sample analysis to inferential population predictions that support business decision-making.
Airbnb’s Statistical Innovation Framework
Airbnb’s engineering team demonstrates inferential statistics applications at platform scale through their sophisticated experimentation frameworks. Senior Data Scientist Qiwen Zhang led development of an “interleaving” methodology that revolutionized search ranking experimentation capabilities, addressing fundamental challenges in traditional A/B testing approaches.
Traditional A/B Testing Limitations: Airbnb’s booking funnel conversion rates averaged 2-3%, meaning traditional statistical power calculations required massive sample sizes to detect meaningful improvements. Classical A/B testing approaches required running experiments for 6-8 weeks with millions of users to achieve 80% statistical power for detecting a 2% relative improvement in booking conversion rates.
The interleaving solution involves presenting search results from multiple ranking algorithms simultaneously within the same user session, then using sophisticated statistical inference to determine superior performance. Unlike traditional A/B testing that randomly assigns users to different groups, interleaving mixes results from different algorithms within individual sessions and applies probability theory to evaluate performance differences.
Interleaving Statistical Framework: The methodology achieves 99.5% reduction in required experimental runtime and 96% reduction in traffic allocation requirements while maintaining 82% consistency with traditional A/B testing conclusions. This innovation enabled increasing algorithmic testing capacity from 3-4 experiments per quarter to 20-25 experiments.
The statistical foundation underlying this success exemplifies the transition from descriptive to inferential analysis. Rather than simply reporting past user interactions, Airbnb’s framework uses sampling distributions and confidence intervals to predict algorithm performance across their entire user population while maintaining rigorous standards for statistical significance.
Probability Distributions and Business Applications
Probability distributions provide the mathematical foundation for inferential statistics by modeling uncertainty and enabling systematic risk assessment in business environments. The normal distribution serves as the cornerstone for most statistical analyses because of its mathematical properties and widespread occurrence in business phenomena ranging from customer response times to sales performance variations.
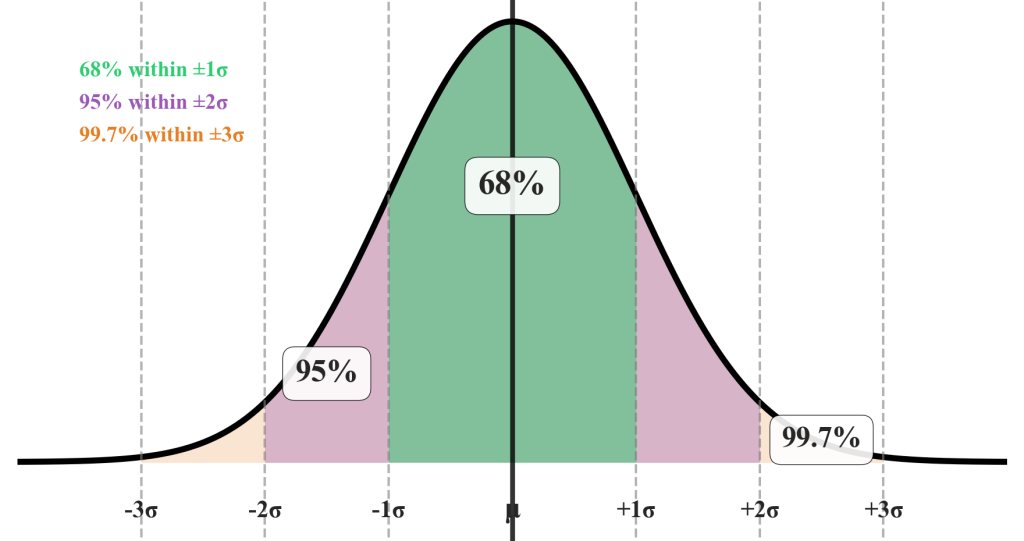
Figure 6.2.2: Normal distribution properties showing the 68-95-99.7 rule with business applications. This visualization demonstrates how approximately 68% of observations fall within one standard deviation, 95% within two standard deviations, and 99.7% within three standard deviations, enabling systematic risk assessment and quality control standards.
The normal distribution’s bell-shaped curve represents the probability that specific values will occur, with approximately 68% of observations falling within one standard deviation of the mean, 95% within two standard deviations, and 99.7% within three standard deviations. These properties enable systematic risk assessment and decision-making under uncertainty that regulatory environments and stakeholder accountability demand.
Business Risk Assessment Applications: Manufacturing organizations use normal distribution properties to establish quality control limits, with measurements falling outside expected ranges triggering investigation protocols. Service organizations apply similar frameworks to response time monitoring, identifying system performance issues through statistical deviation detection rather than arbitrary thresholds.
Sampling Distributions and Population Insights
Sampling distributions represent the bridge between individual sample results and population inferences, enabling understanding of how sample means vary across repeated sampling and quantifying the reliability of analytical conclusions. The Central Limit Theorem provides the mathematical guarantee that sample means approximate normal distributions regardless of the original population distribution.
This mathematical property makes inferential statistics possible even when working with non-normal business data such as skewed revenue distributions or discrete customer satisfaction ratings. Understanding sampling distribution concepts enables evaluating the reliability of analytical conclusions and communicating uncertainty appropriately to business stakeholders who must make resource allocation decisions.
When calculating a sample mean customer satisfaction score of 4.2 from 200 survey responses, the sampling distribution quantifies how much this estimate might vary if different samples were collected from the same population. This variability assessment directly impacts confidence in business recommendations, determining whether observed differences represent genuine improvements or random sampling variation.
JASP Statistical Analysis Implementation
JASP’s statistical analysis capabilities transform probability concepts and inferential foundations into practical tools for business decision-making through its intuitive interface and comprehensive output options. The software organizes statistical procedures logically within structured menus, progressing systematically from descriptive to inferential analysis.
JASP Menu Organization: Statistical procedures are accessible through Common → Descriptive Statistics for foundational analysis, leading to T-Tests → One Sample T-Test and T-Tests → Independent Samples T-Test for inferential testing. Advanced analysis proceeds through Common → Correlation Matrix and Regression → Linear Regression for complex modeling applications.
JASP emphasizes statistical accuracy through automated inclusion of confidence intervals, significance indicators, and diagnostic information that supports professional analysis standards required in regulatory environments. The Plots section within each analysis provides essential visualizations including normal distribution curves and sampling distribution approximations that help communicate uncertainty to non-technical stakeholders.
Professional Statistical Output: JASP generates comprehensive statistical reports that include assumption checking, effect sizes, and confidence intervals formatted for business communication. The transition from Excel’s descriptive capabilities to JASP’s inferential analysis represents a significant advancement in analytical toolkit capabilities for correlation analysis and regression modeling applications.
Industry Applications Across Sectors
Retail and E-commerce
Retail organizations use inferential statistics for inventory forecasting, using sales data from sample stores or time periods to predict demand across entire store networks. Seasonal adjustment factors, promotional impact assessments, and new product introduction planning all rely on sampling distribution theory to extrapolate from limited observations to system-wide projections.
Healthcare and Clinical Research
Clinical trial methodology exemplifies inferential statistics applications in regulated environments where statistical rigor directly impacts patient safety and regulatory approval. Treatment effectiveness assessments require careful attention to error rates, with confidence intervals providing essential information for medical decision-making under uncertainty.
Manufacturing and Quality Control
Manufacturing operations integrate inferential statistics into statistical process control frameworks, using sample measurements to monitor entire production processes. Control chart methodologies rely on sampling distribution theory to distinguish between normal process variation and special causes requiring intervention.
Financial Services and Risk Management
Financial institutions apply inferential statistics extensively in credit risk modeling, using historical default data to predict portfolio performance under various economic scenarios. Investment management relies on inferential methods for performance attribution, benchmark comparison, and risk-adjusted return calculations.
Key Concepts Summary
This chapter established the fundamental distinction between descriptive and inferential statistics, demonstrating how probability distributions and sampling theory enable evidence-based business decision-making under uncertainty. The normal distribution provides mathematical foundations for risk assessment, while the Central Limit Theorem enables statistical inference regardless of original population distributions. Professional statistical software like JASP transforms these theoretical concepts into practical analytical tools for organizational strategy development.
References
Adhikari, A., DeNero, J., & Wagner, D. (2022). Computational and inferential thinking: The foundations of data science (2nd ed.). https://inferentialthinking.com/
Irizarry, R. A. (2024). Introduction to data science: Data analysis and prediction algorithms with R. https://rafalab.dfci.harvard.edu/dsbook/
Timbers, T., Campbell, T., & Lee, M. (2024). Data science: A first introduction. https://datasciencebook.ca/
Zhang, Q., Zhu, Y., Yin, A., Liu, X., & Tan, C. (2022, October 12). Beyond A/B test: Speeding up Airbnb search ranking experimentation through interleaving. The Airbnb Tech Blog. https://medium.com/airbnb-engineering/beyond-a-b-test-speeding-up-airbnb-search-ranking-experimentation-through-interleaving-7087afa09c8e
