Chapter 2.2: Understanding Data Types – Quantitative vs. Qualitative Data
This chapter examines the fundamental distinction between quantitative and qualitative data types, establishing essential foundations for systematic data analysis. Key concepts include the characteristics that define each data type, their appropriate applications in professional contexts, and the methodological considerations for integrating both approaches in comprehensive analytical frameworks.
Analytical Framework: Customer Experience at Starbucks Corporation
Starbucks Corporation operates over 33,000 stores worldwide, serving millions of customers daily while maintaining consistent brand experience across diverse markets. The company’s approach to understanding customer satisfaction, loyalty, and purchasing decisions demonstrates the sophisticated integration of both quantitative and qualitative data collection methodologies required for comprehensive business analysis.
The fundamental business question—”What makes customers choose us over competitors?”—cannot be answered through numerical analysis alone, nor through customer opinions in isolation. Instead, systematic data collection employs both measurement approaches to construct complete analytical understanding of customer behavior and preferences.
Quantitative measurement systems at Starbucks capture precise numerical data revealing behavioral patterns. Mobile applications track wait times averaging several minutes during peak hours, spending per visit varying by location and time, visit frequency showing higher engagement among loyalty members, and product combinations indicating customers purchasing specialty drinks often buy food items. Point-of-sale systems generate millions of numerical data points daily, enabling mathematical analysis of customer behavior trends.
Qualitative data collection provides essential context that numerical analysis cannot capture. Annual customer interviews employing open-ended questions such as “What does your morning coffee routine mean to you?” generate rich, descriptive responses: “It’s my moment of calm before the day begins,” or “The baristas remember my name, which makes me feel valued.” These responses resist numerical reduction while providing crucial insights into emotional factors driving customer behavior.
The analytical power emerges through strategic combination of both data types. Quantitative analysis reveals that stores with faster service achieve higher satisfaction scores, while qualitative research explains why speed matters to customers. Interview data indicates customers value predictable timing for morning routine planning rather than efficiency alone, leading to innovations like mobile ordering that address both measurable wait time issues and underlying emotional needs for control.
Quantitative Data: Mathematical Measurement Foundations
Quantitative data represents information that can be measured, counted, or expressed numerically, enabling mathematical operations and statistical analysis. This data type answers questions about magnitude, frequency, and extent by providing precise numerical values that support comparison, averaging, and mathematical manipulation.
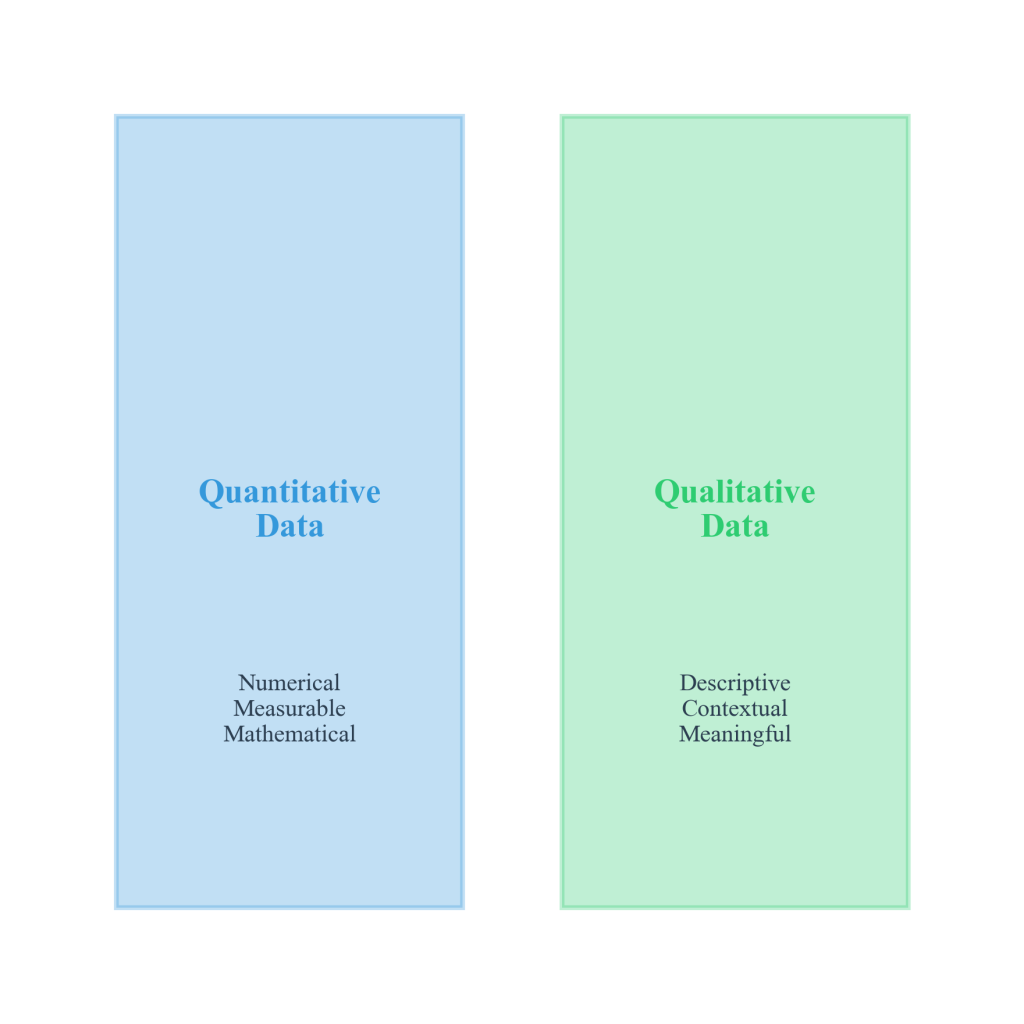
Figure 2.2.1: Visual representation of the fundamental classification system distinguishing quantitative data (numerical measurements enabling mathematical operations) from qualitative data (descriptive characteristics capturing meaning and context). This framework guides analytical methodology selection in data science applications.
The defining characteristic of quantitative data extends beyond mere numerical representation to require meaningful quantities where mathematical operations produce interpretable results. When Starbucks records a customer expenditure of $7.81, this represents a true quantity enabling addition to other purchases, average calculations, and meaningful comparisons across transactions.
Professional context applications demonstrate quantitative data across industries. Healthcare organizations measure patient vital signs including blood pressure (120/80 mmHg), heart rate (72 beats per minute), and temperature (98.6°F). These measurements enable physicians to track changes over time, compare patients against normal ranges, and calculate medication dosages based on body weight. Manufacturing companies rely on production metrics including units produced per hour (847 widgets), defect rates (0.3%), and energy consumption (1,247 kilowatt-hours).
The analytical power of quantitative data derives from its precision and mathematical tractability. Percentage changes in average transactions can be calculated over time, enabling direct measurement of business growth trends. These mathematical relationships would be impossible to establish with non-numerical information, highlighting the essential role of quantitative data in systematic analysis.
|
Industry/Context |
Quantitative Examples |
Qualitative Examples |
|
Healthcare |
Blood pressure (120/80), heart rate (72 bpm), temperature (98.6°F), medication dosages |
“Sharp, stabbing pain,” “feeling dizzy and nauseous,” patient comfort assessments |
|
E-commerce |
Page views (2,847), conversion rate (3.2%), cart value ($67.50), bounce rate |
“Website is confusing,” “checkout process feels secure,” brand perception themes |
|
Education |
Test scores (87%), attendance rate (94%), study hours (6 per week), enrollment numbers |
“Math makes me anxious,” teaching style preferences, learning challenge descriptions |
|
Manufacturing |
Units produced (1,247), defect rate (0.3%), energy usage (15,400 kWh), cycle time |
Quality assessments, worker safety concerns, equipment performance descriptions |
|
Social Media |
Followers (12,450), engagement rate (4.7%), post reach (8,932), click-through rates |
Comment sentiment, brand mentions, user-generated content themes, community feedback |
However, quantitative data exhibits important limitations in analytical scope. Numbers can measure phenomena occurrence but often cannot explain causation. Starbucks might observe significant sales decreases on certain days, but quantitative data alone cannot reveal whether this resulted from weather conditions, local events, or competitor actions.
Qualitative Data: Capturing Human Experience and Context
Qualitative data represents information describing qualities, characteristics, or attributes that resist numerical measurement. This data type captures the richness of human experience, opinion, and context through words, images, observations, and other non-numerical formats. While quantitative data reveals what occurs, qualitative data explains why phenomena happen and their meaning to affected individuals.
The essential characteristic of qualitative data lies in its descriptive nature. When Starbucks customers describe their coffee experience as “comforting,” “energizing,” or “disappointing,” these descriptive terms carry meaning that cannot be reduced to numbers without losing important nuance. A customer explaining that visiting Starbucks feels like “a small luxury that makes my difficult day more manageable” provides insight into purchasing decisions that numerical transaction data could never reveal.
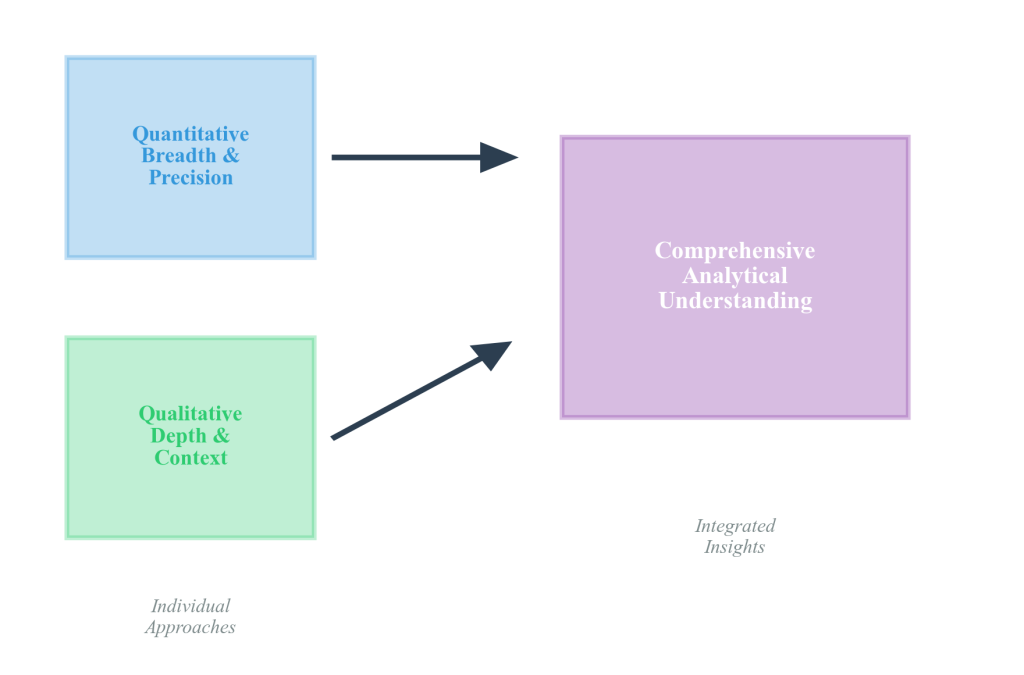
Figure 2.2.2: Conceptual model illustrating how quantitative and qualitative data integration creates comprehensive analytical understanding. The framework shows quantitative data providing breadth and measurement precision while qualitative data adds depth and contextual meaning, resulting in insights neither approach achieves independently.
Professional applications of qualitative data span numerous organizational contexts. Customer service organizations analyze support tickets and chat transcripts to understand service quality dimensions. A customer stating, “The representative was technically correct but made me feel like my problem wasn’t important,” reveals service quality aspects—empathy and respect—that customer satisfaction scores might miss entirely.
Healthcare providers collect extensive qualitative data through patient interviews and clinical documentation. When patients describe pain as “sharp, stabbing sensations that feel like electric shocks,” these descriptions guide diagnostic decisions in ways that simple 1-10 pain scales cannot achieve. The qualitative description suggests specific nerve-related conditions influencing treatment approaches.
The analytical strength of qualitative data lies in its capacity to capture complexity, context, and meaning. Human experiences often exhibit multifaceted and contradictory characteristics—individuals might simultaneously appreciate and dislike aspects of their work environment. Qualitative data preserves these nuances rather than forcing responses into predetermined numerical categories.
Mixed-Method Integration: Synergistic Analytical Approaches
Sophisticated data science projects combine quantitative and qualitative data strategically to leverage the strengths of both approaches while mitigating individual limitations. This integration creates insights that neither data type could provide independently, enabling comprehensive understanding of complex phenomena.
Integration example: Investigating declining sales at a specific Starbucks location requires both analytical approaches. Quantitative analysis reveals decreased average transaction amounts and customer visit frequency over recent months, with competitor analysis showing a new coffee shop opening nearby. These numerical findings clearly indicate a problem and suggest external competition as a potential cause.
Qualitative research uncovers additional factors that numerical analysis missed. Customer interviews reveal that while the new competitor offers convenience, customers are primarily frustrated with increased noise levels from store renovations, longer wait times from new employee training, and seating arrangement changes eliminating popular study spaces. Quantitative data identified the problem’s magnitude, but qualitative insights revealed actual causes and potential solutions.
This integrated understanding enables more effective interventions. Rather than simply reducing prices to compete (a strategy suggested by quantitative competitor analysis), management can address specific experience issues identified through qualitative research—adjusting store layouts, implementing noise reduction measures, and improving staff training protocols.
Integration methodology requires careful planning to ensure both data types contribute meaningfully to analytical insights. Successful mixed-method projects often begin with quantitative analysis to identify patterns and establish baseline measurements, followed by qualitative research to explain patterns and generate new hypotheses, then additional quantitative analysis to test qualitative insights across larger populations.
Analytical Applications in Data Science Practice
Understanding the distinction between quantitative and qualitative data proves essential for making appropriate analytical choices throughout the data science lifecycle. Different data types require different collection methods, storage approaches, analytical techniques, and interpretation frameworks.
Excel methodology for data type analysis employs different functional approaches. Statistical functions and pivot tables work effectively with quantitative data, enabling calculations of means, medians, and correlations. Qualitative data in Excel requires text analysis functions and categorization schemes that organize themes rather than calculating numerical summaries.
JASP analytical framework excels at statistical analysis of quantitative data, providing tools for hypothesis testing and regression analysis. Working with qualitative data in JASP often requires first coding information into numerical formats while preserving original meaning and context.
KNIME workflow approach enables sophisticated integration of both data types through automated processing pipelines, allowing systematic analysis of mixed-method datasets.
The selection between quantitative and qualitative approaches depends on research questions and available resources. Quantitative methods typically prove superior for questions about magnitude, frequency, and relationships that can be measured numerically. Qualitative methods excel at exploring causal mechanisms and meanings that individuals attach to their experiences.
Methodological Considerations and Analytical Implications
Different data types require fundamentally different analytical approaches and interpretation frameworks. Quantitative analysis employs mathematical and statistical procedures assuming numerical relationships and distributions. Descriptive statistics summarize central tendencies and variability, while inferential statistics test hypotheses and estimate population parameters.
Qualitative analysis focuses on identifying themes, patterns, and meanings within textual or observational data. Coding procedures systematically categorize information, while constant comparative methods reveal relationships between categories. Theoretical frameworks guide interpretation and help researchers understand how findings relate to broader contexts.
Ethical considerations apply differently to each data type. Quantitative data often involves privacy concerns related to numerical tracking and measurement, while qualitative data raises issues about context preservation and participant voice representation. Both approaches require careful consideration of consent, confidentiality, and appropriate use of collected information.
The choice between quantitative and qualitative approaches depends on research questions, available resources, and intended applications. Quantitative methods excel at measuring magnitude, frequency, and relationships expressible numerically. Qualitative methods provide superior insights into processes, experiences, and meanings that resist numerical quantification.
Foundation for Advanced Data Analysis
This examination of quantitative and qualitative data types establishes essential foundations for subsequent chapters exploring discrete and continuous variables, data sources and collection methods, and ethical considerations in data science practice. The distinction between these fundamental data types influences every aspect of data science methodology, from initial data collection planning through final interpretation and presentation of analytical results.
Understanding these data type characteristics enables appropriate tool selection, methodology design, and interpretation frameworks that maximize analytical insights while maintaining scientific rigor. This foundation proves essential for the systematic data analysis approaches examined throughout this text.
References
Adhikari, A., DeNero, J., & Wagner, D. (2022). Computational and inferential thinking: The foundations of data science (2nd ed.). https://inferentialthinking.com/
Irizarry, R. A. (2024). Introduction to data science: Data wrangling and visualization with R. https://rafalab.dfci.harvard.edu/dsbook-part-1/
Timbers, T., Campbell, T., & Lee, M. (2024). Data science: A first introduction. https://datasciencebook.ca/
