Chapter 2.4: Structured vs. Unstructured Data
This chapter examines the fundamental distinctions between structured, unstructured, and semi-structured data formats, exploring their characteristics, analytical implications, and strategic importance in data science practice. Understanding these format types provides essential foundation knowledge for data classification, tool selection, and analytical approach design throughout systematic data analysis workflows.
Healthcare Data Integration: A Complex Reality
Mayo Clinic, one of the nation’s leading healthcare systems, treats over 1.3 million patients annually while managing an extraordinary volume and variety of data that exemplifies the spectrum from highly structured to completely unstructured information. Understanding how Mayo Clinic approaches this data complexity reveals why distinguishing between data formats remains crucial for any organization seeking to extract meaningful insights from their information assets.
A single patient’s journey through Mayo Clinic’s integrated healthcare system generates data in fundamentally different formats that require distinct analytical approaches while contributing to comprehensive understanding of health status and treatment effectiveness. When 67-year-old Margaret Thompson arrives for her cardiac care appointment, her experience creates data across the complete spectrum of organizational formats.
The structured data component of Margaret’s visit follows rigorous, predefined formats that enable immediate mathematical analysis and systematic comparison. Her vital signs are recorded as precise numerical measurements: blood pressure (142/88 mmHg), heart rate (76 beats per minute), weight (168.5 pounds), and temperature (98.4°F). Laboratory results provide equally structured information with standardized reference ranges, medication dosages follow exact specifications, and appointment scheduling data fits predetermined time slots and provider categories.
This structured information integrates seamlessly into Mayo Clinic’s electronic health record systems, enabling automated alerts for dangerous drug interactions, statistical analysis of treatment effectiveness across patient populations, and predictive modeling for health outcomes. The mathematical precision and organizational consistency allow immediate computational processing and systematic analysis.
However, the most clinically valuable insights often emerge from unstructured data that resists neat categorization but provides rich contextual understanding. Dr. Jennifer Chen’s consultation notes capture nuances that structured fields cannot accommodate: “Patient reports feeling ‘heavy and tired’ especially when climbing stairs to her second-floor bedroom. Describes chest discomfort as ‘tight band around my chest’ rather than sharp pain. Appears anxious about upcoming family wedding, concerned about her ability to participate fully.”
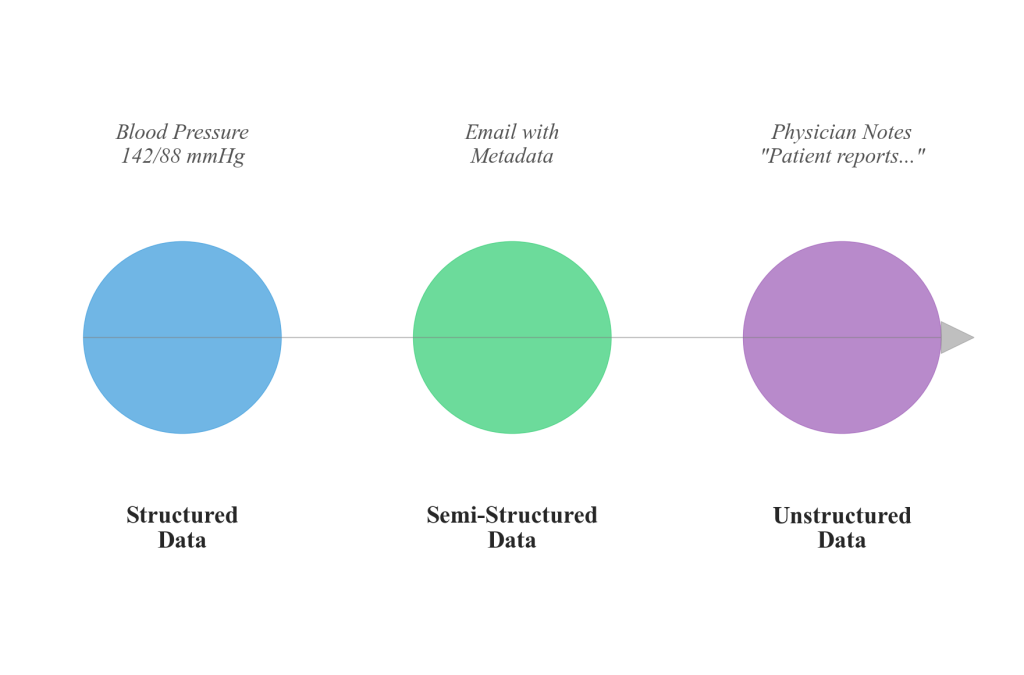
Figure 2.4.1: Healthcare organizations manage data across a complete spectrum from highly structured numerical measurements to completely unstructured narrative assessments. This illustration demonstrates how different data formats contribute distinct analytical value while requiring different processing approaches for meaningful insight extraction.
Medical imaging studies generate complex visual data requiring specialized interpretation, while patient feedback surveys contain open-ended responses like “The staff made me feel heard and respected throughout a scary time.” These unstructured formats preserve human complexity and contextual richness that numerical classifications cannot capture.
Professional Application: The transformative potential emerges when Mayo Clinic systematically integrates both data formats. Structured data analysis might reveal that patients with Margaret’s specific clinical profile typically respond well to a particular treatment protocol, with 78% showing measurable improvement within six weeks. Meanwhile, unstructured data analysis of physician notes and patient communications reveals that patients who express anxiety about specific life events often experience different adherence patterns to treatment recommendations.
Structured Data: The Foundation of Systematic Analysis
Structured data represents information organized into predefined formats with clear relationships between different elements, typically arranged in rows and columns where each data point has a specific position and meaning. This organization enables direct mathematical operations, systematic queries, and automated processing that forms the backbone of traditional data analysis approaches.
The defining characteristics of structured data include its predictable format, consistent organization, and immediate readiness for mathematical analysis. When Mayo Clinic records a patient’s blood pressure as 142/88 mmHg, this measurement fits precisely into predetermined fields with standardized units, enabling direct comparison with previous readings, calculation of trends over time, and automatic flagging of values outside normal ranges.
Database systems can immediately sort, filter, and analyze structured information without requiring interpretation or transformation. This computational efficiency makes structured data the preferred format for operational reporting, financial analysis, and systematic performance monitoring across organizational contexts.
Structured data appears consistently across different organizational contexts. Retail companies maintain structured customer databases containing precise transaction records: purchase amounts ($67.43), product SKU numbers (TB-4477-BLU), timestamps (2024-03-15 14:23:17), and customer identification numbers. Financial institutions rely on structured account data including balances, transaction types, and precisely categorized expense classifications. Manufacturing organizations track structured operational metrics like production quantities, defect rates, quality measurements, and equipment performance indicators measured in standardized units.
Analytical Methodology: Excel excels at working with structured data through functions that can automatically calculate sums, averages, and trends across columns and rows. Database queries can instantly retrieve specific subsets of information based on multiple criteria, while statistical software like JASP can immediately apply mathematical models to test hypotheses and identify relationships.
However, structured data’s strength—its rigid organization—also represents its primary limitation. Complex human experiences, creative content, and nuanced business insights often cannot be reduced to predetermined categories without losing essential meaning. A customer’s satisfaction with a product involves emotional responses, contextual factors, and individual perspectives that resist simple numerical classification.
Unstructured Data: Capturing Human Complexity
Unstructured data encompasses information that lacks predefined organization, fixed schemas, or consistent formats, typically including text documents, images, audio recordings, video content, and other media that require interpretation rather than direct mathematical manipulation. This data format captures the richness of human communication and experience but demands specialized approaches for analysis and insight extraction.
Unlike structured data’s predictable organization, unstructured data presents information in natural human formats that reflect how people actually communicate and express ideas. Medical records include physicians’ narrative assessments describing patient conditions in professional medical language, while patient feedback surveys contain personal stories about healthcare experiences written in everyday language with varying vocabulary, grammar, and organizational approaches.
The characteristics that define unstructured data create both opportunities and challenges for data science applications. Rich contextual information provides insights unavailable through structured formats alone—a patient describing their pain as “like a hot knife twisting” conveys specific clinical information that numerical pain scales cannot capture.
Cultural nuances, emotional context, and individual perspectives preserved in unstructured formats often reveal the “why” behind patterns that structured data can only quantify. However, unstructured data requires sophisticated processing before traditional analytical methods can be applied. Text analysis techniques must extract meaningful patterns from varying vocabulary, grammar, and writing styles.
Organizations across industries increasingly recognize unstructured data as a crucial source of competitive advantage and operational insight. Technology companies analyze millions of customer support tickets to identify common product issues and improve user experience. Financial institutions process loan applications containing narrative descriptions of business plans and financial circumstances. Educational institutions analyze student essays and feedback to understand learning effectiveness and program improvement opportunities.
Processing Methodology: Working with unstructured data requires different approaches than traditional structured analysis. While Excel can store and display text content, extracting analytical insights requires specialized functions and often external processing tools. Text analysis in Excel involves complex formulas for pattern matching and content categorization. JASP’s statistical capabilities apply to unstructured data after it has been processed into structured formats through coding, categorization, or quantitative content analysis.
Semi-Structured Data: Bridging Organized and Flexible Formats
Semi-structured data occupies the middle ground between rigid structured formats and completely unstructured content, providing organizational elements while maintaining flexibility for varying content types and formats. This hybrid approach enables systematic processing while accommodating the complexity and nuance of real-world information that doesn’t fit neatly into predetermined categories.
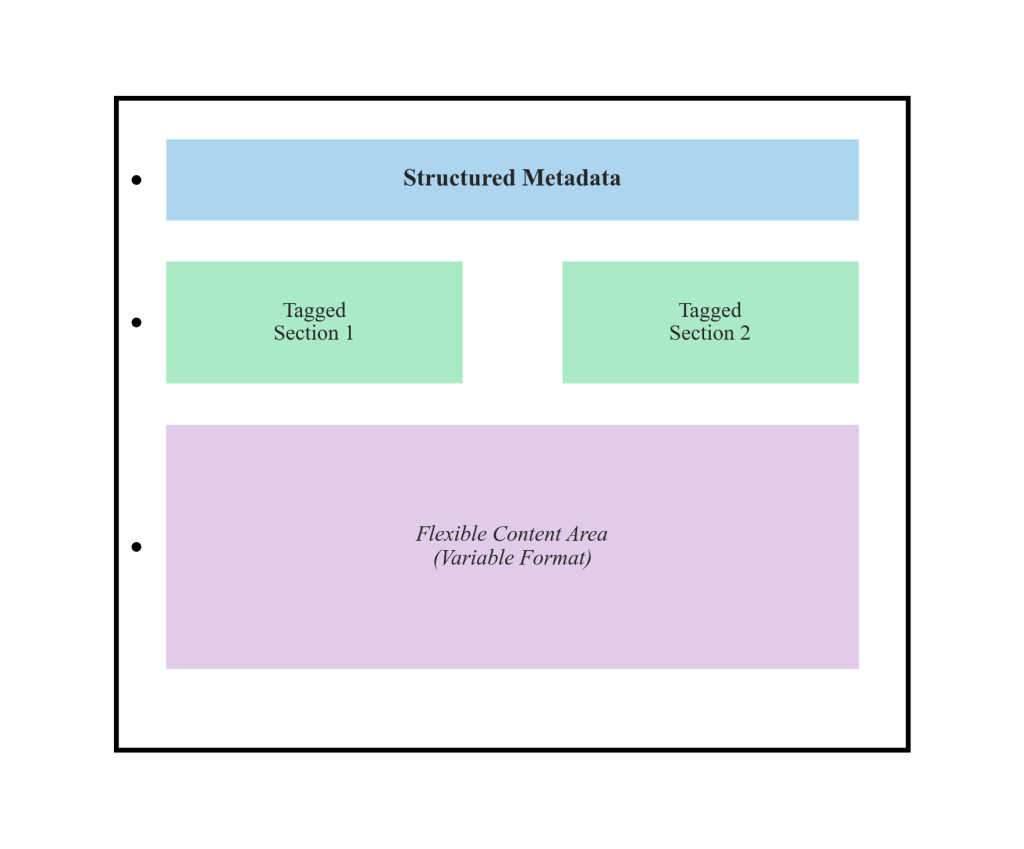
Figure 2.4.2: Semi-structured data combines organizational markers with content flexibility, enabling systematic processing while preserving information richness. This visualization shows how metadata and tagging systems provide structure while allowing diverse content types within the same organizational framework.
The distinguishing characteristic of semi-structured data lies in its use of organizational markers, tags, or metadata that provide structure without requiring complete uniformity in content or format. JSON (JavaScript Object Notation) files exemplify this approach by using labeled fields to organize information while allowing different records to contain varying numbers and types of data elements.
Email messages represent a common example of semi-structured data that most people encounter daily. Email headers provide structured elements including sender, recipient, timestamp, and subject line that enable systematic organization and filtering. However, the message body contains unstructured content that might include text, images, attachments, and formatting that varies significantly across different messages.
Organizational Applications: Organizations increasingly rely on semi-structured formats to balance systematic processing capabilities with the flexibility needed to accommodate evolving business requirements and diverse content types. Customer relationship management systems store structured account information alongside unstructured communication histories and document attachments. E-commerce platforms maintain structured product catalogs while incorporating unstructured customer reviews, images, and multimedia content.
Modern data science tools increasingly accommodate semi-structured formats as organizations recognize their practical value. KNIME workflows can process JSON and XML files while extracting structured elements for statistical analysis and routing unstructured content to appropriate text processing components. Database systems increasingly support semi-structured storage and querying capabilities, enabling organizations to work with diverse data types within integrated analytical frameworks.
Strategic Implications for Data Science Practice
Understanding the distinctions between structured, unstructured, and semi-structured data formats fundamentally influences how data scientists approach projects, select analytical tools, and design processing workflows throughout systematic data analysis methodologies. These format considerations affect every phase from initial business understanding through final deployment and monitoring.
During business understanding phases, recognizing data format characteristics helps establish realistic project scope and timeline expectations. Projects relying primarily on structured data can typically proceed more quickly through data preparation phases, while those requiring significant unstructured data analysis need additional time for content processing and interpretation.
Data exploration activities vary significantly based on format characteristics. Structured data exploration follows established patterns using statistical summaries, distribution analysis, and relationship identification. Unstructured data exploration requires content sampling, thematic analysis, and assessment of language patterns or media characteristics. Semi-structured data exploration combines both approaches while examining the consistency and completeness of organizational elements.
Tool Selection Framework: Excel and traditional statistical software work optimally with structured formats, while specialized text processing, image analysis, or natural language processing tools become necessary for unstructured content. Workflow automation platforms like KNIME provide particular value for projects involving multiple data formats, enabling integrated processing pipelines that handle diverse content types systematically.
The modeling phase approaches vary considerably across data formats. Structured data supports traditional statistical modeling, machine learning algorithms, and mathematical optimization techniques. Unstructured data modeling might involve natural language processing, computer vision, or content classification approaches. Semi-structured data modeling often combines multiple techniques to extract insights from both organized and flexible content elements.
Integration Strategies and Tool Applications
Understanding data format distinctions becomes increasingly important as organizational data environments become more complex and diverse. Most professional data science projects involve multiple formats requiring different processing approaches and analytical techniques. Excel’s capabilities work optimally with structured data through functions, pivot tables, and charting features that assume organized row-and-column formats.
JASP’s statistical analysis requires structured input formats, though systematic approaches exist for converting unstructured content into analyzable structured formats through coding and categorization processes. KNIME’s workflow platform particularly excels at handling multiple data formats within integrated processing pipelines, making it valuable for real-world projects involving diverse content types.
Professional Reality: Professional data scientists spend significant time navigating format complexity, designing processing workflows that accommodate diverse content types, and selecting appropriate tools for each analytical component. Understanding these format distinctions prepares practitioners for the complex reality of organizational data, where systematic integration of multiple format types often produces insights unavailable from any single format alone.
The evaluation and deployment considerations also reflect format characteristics. Structured data models typically enable clear performance metrics and systematic validation approaches. Unstructured data models require more nuanced evaluation considering context, interpretation accuracy, and meaning preservation. Semi-structured approaches need evaluation frameworks that assess both quantitative accuracy and qualitative interpretation effectiveness.
Ethical Considerations: Different data formats present distinct ethical challenges and responsibilities. Structured data analysis must consider representational fairness and statistical bias. Unstructured data processing raises privacy concerns and interpretation responsibilities. Semi-structured data analysis requires careful attention to both quantitative accuracy and qualitative meaning preservation in organizational decision-making contexts.
The systematic understanding of data format characteristics enables more effective project planning, realistic timeline development, and appropriate tool selection throughout data science workflows. These distinctions become particularly important as organizations seek to integrate insights from diverse information sources to support comprehensive decision-making and strategic planning.
Conclusion
The distinctions between structured, unstructured, and semi-structured data formats represent fundamental classification knowledge essential for effective data science practice. Understanding these format characteristics influences every aspect of analytical projects, from initial planning through final implementation and evaluation. As organizations increasingly seek to integrate insights from diverse information sources, systematic understanding of format distinctions becomes crucial for designing effective analytical approaches and selecting appropriate processing tools.
This foundational knowledge supports comprehensive data classification capabilities and informed analytical decision-making throughout systematic data science workflows. The ability to recognize format characteristics, understand their analytical implications, and select appropriate processing approaches represents essential professional competency in contemporary data-driven organizational environments.
References
Adhikari, A., DeNero, J., & Wagner, D. (2022). Computational and inferential thinking: The foundations of data science (2nd ed.). https://inferentialthinking.com/
Irizarry, R. A. (2024). Introduction to data science: Data wrangling and visualization with R. https://rafalab.dfci.harvard.edu/dsbook-part-1/
Mayo Clinic. (2024). About Mayo Clinic. https://www.mayoclinic.org/about-mayo-clinic
Timbers, T., Campbell, T., & Lee, M. (2024). Data science: A first introduction. https://datasciencebook.ca/
