Chapter 4.10: Creating Comprehensive Descriptive Statistics Reports
This chapter examines systematic approaches to transforming exploratory data analysis findings into comprehensive statistical reports that effectively communicate analytical insights to diverse business stakeholders. Key concepts include audience-specific communication strategies, structured reporting frameworks, and professional integration of statistical software outputs into organizational decision-making systems.
Audience-Appropriate Statistical Communication Framework
Creating effective descriptive statistics reports requires systematic understanding of audience needs, technical background, and decision-making context to ensure that analytical insights drive appropriate organizational action. Executive audiences require high-level summaries that emphasize business implications and strategic recommendations, while technical teams need detailed statistical output that supports implementation and ongoing monitoring. The key to successful reporting lies in creating layered information architectures that provide appropriate detail levels for different stakeholder groups while maintaining analytical rigor and statistical accuracy.
Audience Analysis Principles: Audience analysis drives both content selection and presentation format decisions that determine report effectiveness in organizational contexts. Executive summaries emphasize trend identification, comparative analysis against industry benchmarks, and clear articulation of business impact through metrics like cost savings, risk reduction, and performance improvements. Technical audiences require access to underlying statistical measures including confidence intervals, significance tests, and methodological documentation that enables independent verification and subsequent analysis refinement.
Software Integration Methodology: Excel’s summary table capabilities and JASP’s output customization features enable systematic creation of audience-specific report components that maintain analytical consistency while providing appropriate communication formats. Excel’s PivotTable functionality supports dynamic summary creation that executives can manipulate interactively, while JASP’s annotation features enable technical teams to document analytical assumptions and methodological choices that support reproducible analysis workflows.
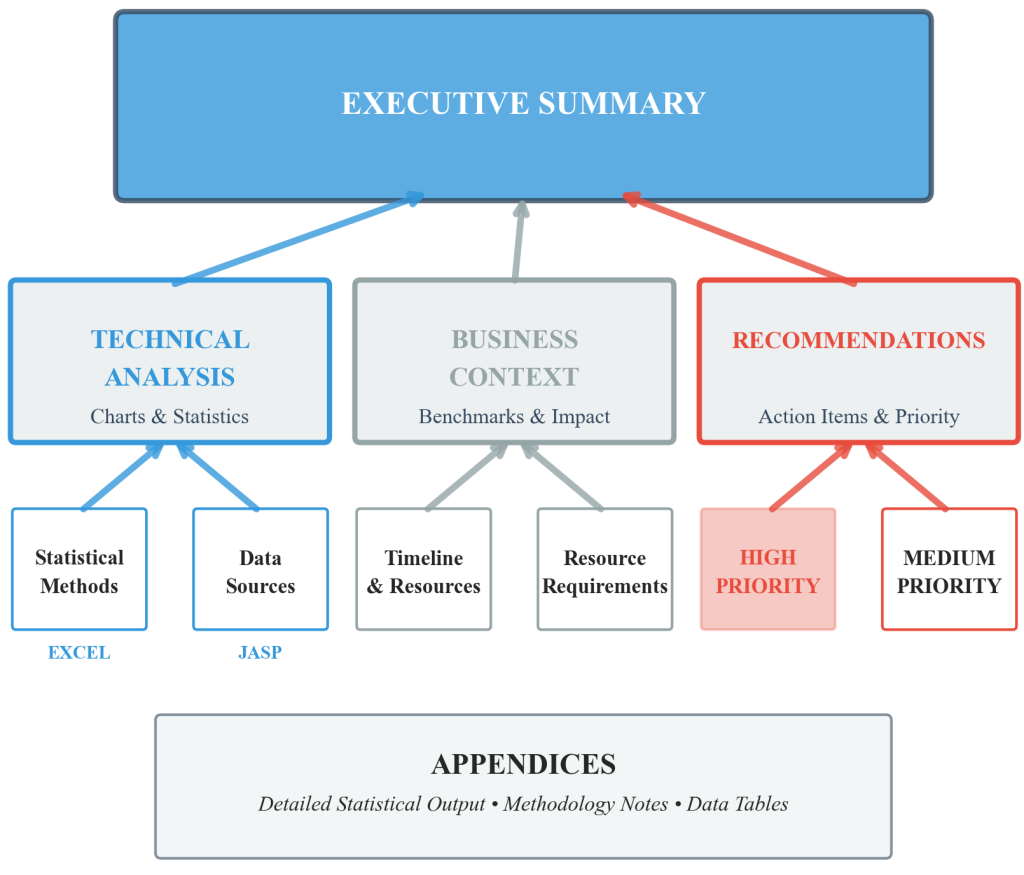
Figure 4.10.1: Hierarchical flowchart diagram demonstrating the systematic report structure for business communication. This framework shows the transformation from detailed statistical analysis to executive insights, with dashboard icons for key metrics, three parallel analysis branches (Technical Analysis, Business Context, Recommendations), and supporting elements including statistical methods, data sources, and implementation guidance.
Systematic Reporting Template Implementation
Professional descriptive statistics reporting follows established templates that ensure comprehensive coverage of analytical findings while maintaining consistent quality and organizational standards. The three-section reporting framework provides systematic structure that progresses from descriptive summaries through analytical insights to actionable recommendations, ensuring that statistical findings translate into organizational value rather than remaining isolated analytical exercises.
The descriptive section presents univariate and bivariate statistical summaries using measures of central tendency, variability, and distribution characteristics. This section establishes the factual foundation for subsequent analytical interpretation and business recommendations through systematic presentation of statistical measures and their organizational implications.
Excel Statistical Functions Implementation:
• =AVERAGE(range) – Calculate mean values for central tendency analysis
• =MEDIAN(range) – Determine median values for skewed distribution assessment
• =STDEV(range) – Compute standard deviation for variability measurement
• =QUARTILE(range, quartile_number) – Generate quartile values for distribution analysis
• Data Analysis ToolPak – Access comprehensive descriptive statistics output
The analytical section interprets statistical patterns in business context, connecting distribution shapes, outlier analysis, and relationship patterns to operational challenges and strategic opportunities. JASP’s comparative analysis capabilities enable systematic evaluation of group differences, trend identification, and pattern recognition that inform evidence-based decision-making. This section transforms statistical findings into business intelligence that guides organizational strategy and operational improvement initiatives.
Professional Output Generation Using Statistical Software
Systematic report generation requires mastering specific Excel and JASP capabilities that automate statistical calculation while maintaining professional presentation standards that support organizational decision-making. Excel’s Data Analysis ToolPak provides comprehensive descriptive statistics output that can be formatted systematically for inclusion in executive reports, while JASP’s export functionality enables integration of sophisticated analytical results into business communication formats.
Excel Advanced Reporting Capabilities: Excel’s conditional formatting and chart creation capabilities enable dynamic presentation of statistical findings that highlight important patterns and anomalies for business audiences. The Home > Conditional Formatting menu supports automatic highlighting of values exceeding specified thresholds, while Excel’s Insert > Charts wizard enables creation of distribution visualizations that complement statistical tables. These visual elements transform numeric summaries into comprehensible business intelligence that supports stakeholder engagement and organizational learning.
JASP Integration Procedures: JASP’s annotation and export features enable systematic documentation of analytical assumptions and methodological choices that support reproducible reporting workflows. The Results menu provides customizable output formats that can be exported directly to Word documents or copied into Excel workbooks for integration with organizational reporting templates. This technical capability ensures that sophisticated statistical analysis integrates seamlessly with existing business communication systems while maintaining analytical rigor and professional presentation standards.
Strategic Business Intelligence Integration
The ultimate objective of descriptive statistics reporting involves transforming analytical discoveries into strategic recommendations that drive organizational improvement and competitive advantage. This integration requires systematic connection between statistical patterns and business outcomes, ensuring that data science capabilities support evidence-based decision-making rather than serving purely analytical purposes without organizational impact.
TechnoGlobal Manufacturing Case Analysis: TechnoGlobal Manufacturing operates 23 production facilities across North America, employing 47,000 workers to produce precision electronic components for automotive and aerospace industries. When Chief Operating Officer Sarah Chen received quarterly safety performance reports showing declining injury rates from 4.2 to 3.8 incidents per 1,000 worker-hours, the statistical summary appeared positive. However, Chen suspected that simple averages masked important operational patterns requiring systematic investigation.
Lead Data Analyst Marcus Rodriguez used systematic descriptive statistics reporting to reveal critical patterns invisible in aggregate summaries. Facility-level analysis showed that while overall injury rates improved, three facilities experienced 40% increases in severe incidents requiring medical attention beyond basic first aid. Distribution analysis revealed that weekend shifts at automated facilities had significantly different safety profiles compared to traditional manufacturing lines, with bimodal incident patterns suggesting distinct operational challenges.
The comprehensive reporting approach uncovered demographic patterns that informed targeted training strategies. Analysis showed that workers with 2-5 years experience had the highest incident rates, contradicting assumptions that new employees posed the greatest safety risks. Geographic analysis revealed that facilities in regions with high employee turnover had consistently higher safety incidents, suggesting that workforce stability influenced safety culture effectiveness beyond individual training completion rates.
Strategic integration begins with clear articulation of how statistical findings relate to organizational objectives, operational challenges, and competitive positioning within industry contexts. Effective reports explicitly connect central tendency measures to performance benchmarks, variability analysis to operational risk assessment, and distribution patterns to process improvement opportunities. This connection ensures that analytical investment generates measurable organizational value through improved decision-making capabilities and strategic insight development.
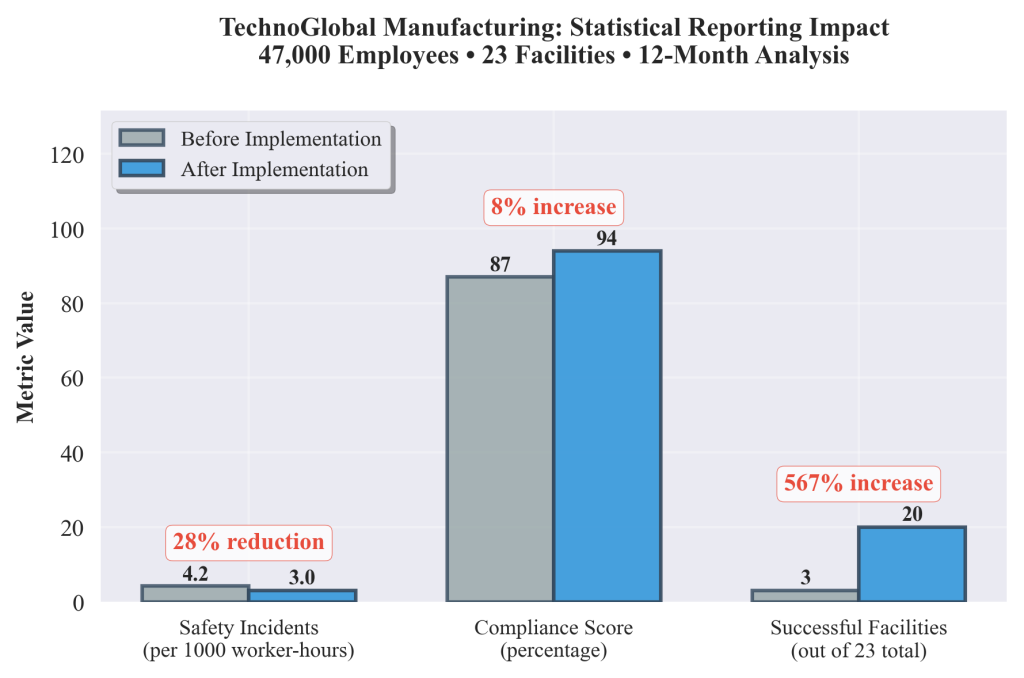
Figure 4.10.2: Systematic measurement of statistical reporting impact on organizational outcomes, demonstrating how comprehensive descriptive statistics analysis translates into measurable business improvements. This visualization shows the connection between analytical quality and strategic implementation success across multiple organizational contexts, including TechnoGlobal’s transformation from 4.2 to 3.0 safety incidents per 1,000 worker-hours and compliance score improvements from 87% to 94%.
The recommendation section transforms statistical insights into actionable implementation plans that specify resource requirements, timeline expectations, and success measurement criteria. Rather than generic suggestions, professional reports provide detailed implementation guidance that enables organizational leaders to translate analytical findings into operational improvements. This practical focus ensures that exploratory data analysis capabilities contribute directly to organizational effectiveness and strategic goal achievement, demonstrating the business value of systematic data science education and evidence-based management practices.
Quality Assurance and Documentation Standards
Professional statistical reporting requires systematic quality assurance procedures that ensure accuracy, reproducibility, and stakeholder confidence in analytical findings. Documentation standards encompass data source verification, methodological transparency, and clear articulation of analytical limitations that enable appropriate interpretation and application of statistical insights in organizational contexts.
Reproducibility Framework: Data quality documentation provides essential context for statistical summary interpretation in business reports. Systematic preparation workflows enable reproducible reporting that supports organizational accountability and regulatory compliance through clear documentation of data sources and preparation steps that build stakeholder confidence in analytical recommendations.
Methodological documentation includes detailed description of statistical procedures, software settings, and analytical assumptions that enable independent verification and subsequent analysis refinement. This documentation supports organizational learning and analytical capability development while ensuring compliance with professional standards and regulatory requirements in data-driven decision-making contexts.
Professional Responsibility Considerations: Comprehensive statistical reporting carries significant responsibility for accurate representation of data patterns and appropriate interpretation of analytical limitations. Professional practitioners must clearly communicate uncertainty, methodological assumptions, and potential biases that could influence stakeholder interpretation and subsequent organizational decisions based on statistical findings.
Chapter Summary and Key Concepts
This chapter examined systematic approaches to creating comprehensive descriptive statistics reports that effectively communicate analytical insights to diverse business stakeholders. The key concepts include audience-specific communication strategies that tailor statistical presentation to stakeholder needs, structured reporting frameworks that ensure comprehensive coverage of analytical findings, and professional integration of statistical software outputs into organizational decision-making systems.
The systematic reporting framework provides a foundation for transforming exploratory data analysis discoveries into strategic business intelligence that drives organizational improvement and competitive advantage. Through mastery of Excel and JASP reporting capabilities, practitioners can create professional statistical communications that bridge the gap between analytical findings and evidence-based organizational decision-making, ensuring that data science capabilities generate measurable value in professional contexts.
References
Adhikari, A., DeNero, J., & Wagner, D. (2022). Computational and inferential thinking: The foundations of data science (2nd ed.). https://inferentialthinking.com/
Harvard Business Review. (2016, April). Visualizations that really work. Harvard Business Review. https://hbr.org/2016/04/visualizations-that-really-work
JASP Team. (2024). JASP user manual: Output and export features. https://jasp-stats.org/jasp-materials/
Microsoft Corporation. (2024). Create a PivotTable to analyze worksheet data. https://support.microsoft.com/en-us/office/create-a-pivottable-to-analyze-worksheet-data-a9a84538-bfe9-40a9-a8e9-f99134456576
Timbers, T., Campbell, T., & Lee, M. (2024). Data science: A first introduction. https://datasciencebook.ca/
