Chapter 4.3: Excel Statistical Functions and Data Analysis Tools
This chapter examines Excel’s comprehensive statistical function library and Data Analysis ToolPak capabilities that enable systematic quantitative analysis in professional business contexts. Key concepts include fundamental statistical functions for central tendency and variability measurement, advanced conditional statistical calculations, and integrated analytical workflows that transform raw data into actionable business insights.
Excel Statistical Function Framework
Excel provides a comprehensive statistical function library that automates calculations essential for exploratory data analysis, enabling professional-quality statistical analysis without complex software or programming requirements. The core functions include AVERAGE() for arithmetic means, MEDIAN() for middle values, MODE.SNGL() for most frequent values, MIN() and MAX() for range identification, STDEV.S() for sample standard deviations, and VAR.S() for sample variances. These functions handle datasets of any size efficiently while providing reliable results that form the foundation for business decision-making.
Function syntax follows consistent patterns: =FUNCTION(range) where range specifies the data cells for calculation. For example, =AVERAGE(B2:B100) calculates the mean of values in cells B2 through B100, while =STDEV.S(B2:B100) computes the sample standard deviation for the same range. This consistent approach enables rapid implementation across multiple variables and datasets while maintaining analytical accuracy and efficiency.
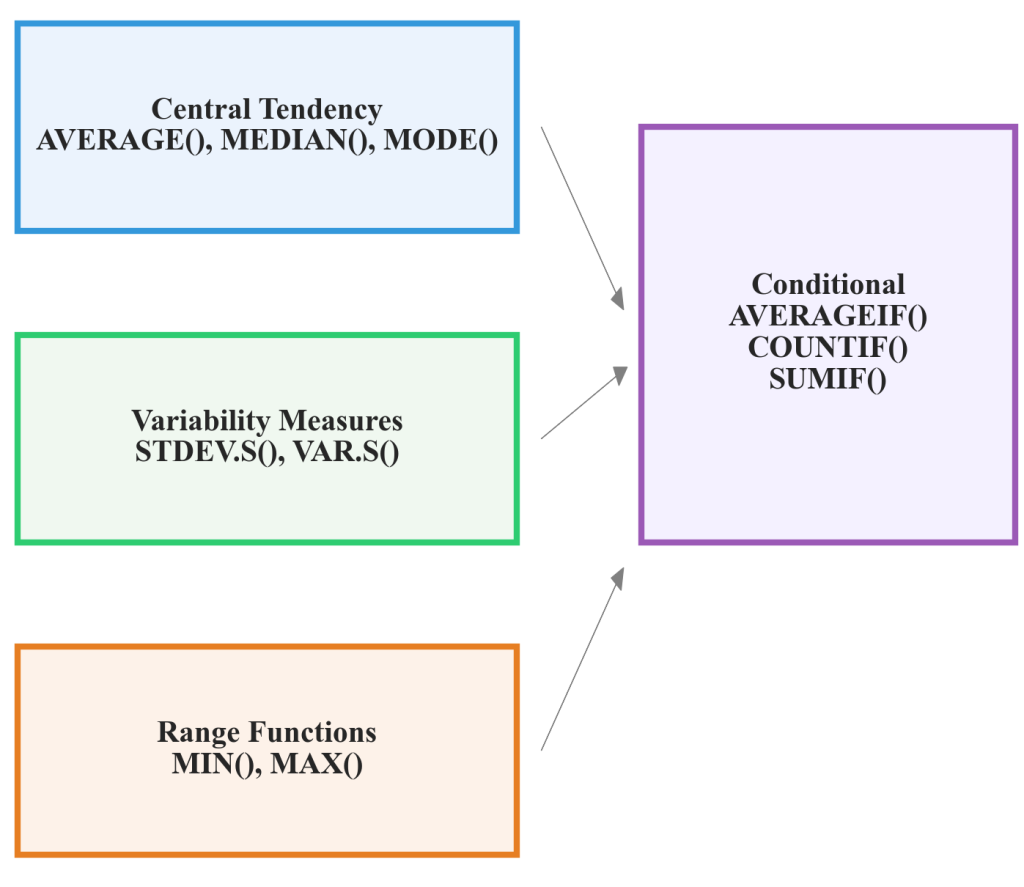
Figure 4.3.1: Excel’s statistical function hierarchy demonstrating the systematic organization of core functions by analytical purpose, showing basic descriptive statistics (AVERAGE, MEDIAN, MODE), variability measures (STDEV.S, VAR.S), and range functions (MIN, MAX) with their respective applications in business analysis contexts.
Advanced function capabilities include error handling and conditional calculations that enhance analytical reliability. Functions like AVERAGEIF() and COUNTIF() enable calculations based on specific criteria, while AGGREGATE() provides robust statistics that automatically exclude errors and hidden rows. These advanced capabilities support sophisticated analysis while maintaining Excel’s user-friendly interface that makes statistical analysis accessible to business professionals without extensive technical training.
RegionalBank Corporation Implementation
RegionalBank Corporation manages 47 branch locations across three states, serving over 180,000 customers with a workforce of 2,300 employees. Operations Director Jennifer Walsh needed to analyze quarterly performance metrics including transaction processing times, customer satisfaction scores, and teller productivity rates. Initially relying on basic Excel formulas that required manual calculation, the approach consumed excessive time while producing inconsistent results that undermined confidence in analytical findings.
By implementing systematic use of Excel’s AVERAGE(), MEDIAN(), STDEV.S(), and related functions, combined with Data Analysis ToolPak capabilities, Walsh’s team reduced analysis time from 8 hours to 45 minutes per quarterly report while eliminating calculation errors. The systematic Excel-based approach enabled consistent, reliable performance analysis that supported evidence-based operational improvements across all branch locations.
Core Statistical Functions
The AVERAGE() function calculates arithmetic means by summing all values in a specified range and dividing by the count of values. This function automatically excludes text entries and empty cells, focusing calculations on numeric data only. For conditional averaging based on specific criteria, AVERAGEIF() function enables filtered calculations that analyze subsets of data meeting defined conditions.
The MEDIAN() function identifies the middle value when data is arranged in ascending or descending order, providing a measure of central tendency less influenced by extreme values than arithmetic means. For datasets with even numbers of values, MEDIAN() calculates the average of the two middle values automatically. This function proves particularly valuable in analyzing skewed distributions where outliers might distort mean calculations.
The MODE.SNGL() function identifies the most frequently occurring value in a dataset, particularly useful for categorical data analysis and identifying common response patterns. For datasets with multiple modes, this function returns the first mode encountered in the data sequence, providing insight into typical or expected values within business operations.
Variability Measurement Functions
Standard deviation and variance functions measure data variability around the mean. STDEV.S() calculates sample standard deviation using the n-1 denominator, appropriate for datasets representing samples from larger populations. VAR.S() provides sample variance, representing the square of the standard deviation. These measures quantify data spread and consistency, essential for quality control and performance assessment applications in business contexts.
Data Analysis ToolPak Capabilities
Excel’s Data Analysis ToolPak extends basic function capabilities with comprehensive statistical analysis tools including descriptive statistics summaries, histogram creation, correlation analysis, and regression capabilities. Accessing the ToolPak requires enabling the add-in through File > Options > Add-Ins > Analysis ToolPak, after which it appears in the Data tab as “Data Analysis.” This powerful toolkit provides professional-grade statistical analysis that complements individual function calculations with comprehensive analytical workflows.
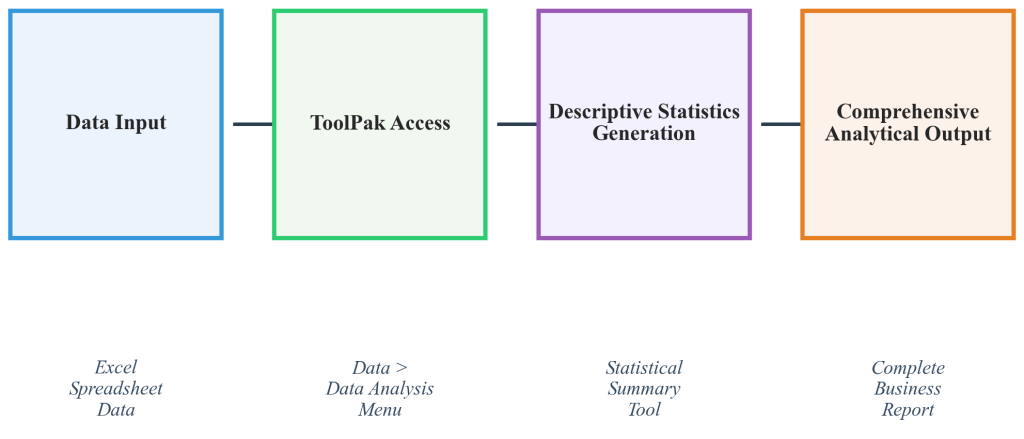
Figure 4.3.2: Data Analysis ToolPak systematic workflow showing the progression from data input through descriptive statistics generation to comprehensive analytical output, demonstrating how integrated tools provide complete statistical summaries that support professional business reporting and decision-making processes.
The Descriptive Statistics tool generates complete statistical summaries including mean, median, mode, standard deviation, variance, range, minimum, maximum, and other measures simultaneously for multiple variables. This comprehensive output eliminates the need for individual function calculations while providing consistent formatting that supports professional reporting and stakeholder communication. The tool also offers confidence intervals and other advanced statistics that enhance analytical depth and reliability.
Histogram creation through the ToolPak enables visual exploration of data distributions that complement numerical statistical measures. The histogram tool automatically determines appropriate bin ranges while allowing custom specifications for specialized analysis requirements. This visual capability supports pattern recognition and distribution assessment that informs appropriate statistical method selection and business interpretation strategies.
Advanced Statistical Functions
The QUARTILE() function calculates quartile values that divide datasets into four equal parts, enabling distribution analysis and outlier identification. The function accepts quartile numbers 0 through 4, representing minimum, first quartile, median, third quartile, and maximum values respectively. This capability supports box plot construction and percentile-based analysis essential for comparative performance assessment.
The AGGREGATE() function provides robust statistical calculations that automatically handle errors, hidden rows, and filtered data. This function combines multiple statistical capabilities with options for excluding various data types, enabling reliable calculations in complex analytical environments where data quality issues might affect standard function performance. The function includes 19 different statistical operations accessible through a single interface.
Conditional Function Syntax
COUNTIF() and SUMIF() Functions:
=COUNTIF(range, criteria) – Conditional counting based on specified criteria
=SUMIF(range, criteria) – Conditional summation based on specified criteria
=AVERAGEIF(range, criteria) – Conditional averaging based on specified criteria
These functions work with text, numeric, and date criteria, providing flexible analytical capabilities for business intelligence and performance monitoring applications.
Professional Applications
Financial services organizations use Excel statistical functions for portfolio analysis, risk assessment, and performance measurement. Investment managers calculate portfolio returns using AVERAGE() functions, measure risk through STDEV.S() calculations, and identify performance outliers using QUARTILE() analysis. These statistical measures support regulatory reporting and client communication requirements while enabling sophisticated risk management strategies.
Healthcare institutions apply Excel functions for quality assurance and operational efficiency analysis. Hospital administrators use MEDIAN() calculations for patient wait time analysis, STDEV.S() functions for treatment outcome consistency assessment, and COUNTIF() functions for compliance monitoring across different departments and service lines. These applications support evidence-based healthcare management and regulatory compliance initiatives.
Manufacturing operations rely on Excel statistical functions for quality control and process improvement initiatives. Production managers use AVERAGE() and STDEV.S() functions to monitor manufacturing consistency, identify process variations requiring attention, and track improvement initiatives over time. These statistical measures support Six Sigma methodologies and continuous improvement programs that enhance operational efficiency and product quality.
Retail Analytics Applications
Retail organizations use Excel functions for sales analysis, inventory management, and customer behavior assessment. Store managers calculate average daily sales using AVERAGE() functions, identify peak sales periods through MAX() analysis, and measure sales consistency using STDEV.S() calculations for inventory planning and staffing decisions. These analytical capabilities support data-driven retail management that optimizes performance across multiple operational dimensions.
Integrated Analytical Workflows
The ToolPak’s Descriptive Statistics feature provides comprehensive statistical summaries suitable for executive reporting and regulatory compliance. This tool calculates mean, median, mode, standard deviation, variance, range, minimum, maximum, sum, count, confidence levels, kurtosis, and skewness measures simultaneously, creating professional statistical reports that support decision-making across organizational levels.
Correlation analysis capabilities within the ToolPak enable relationship identification between multiple variables, supporting business intelligence and predictive modeling initiatives. These analytical tools provide foundation for advanced statistical analysis while maintaining Excel’s accessibility for business professionals across different technical skill levels. The correlation matrix output supports pattern recognition and variable selection for subsequent analytical modeling.
Excel’s statistical function integration with other analytical tools creates comprehensive workflows that transform raw data into actionable business insights. Functions can be combined with conditional formatting, pivot tables, and charting capabilities to create dynamic analytical dashboards that automatically update as underlying data changes, supporting real-time business intelligence and operational monitoring applications.
Key Concepts Summary
Excel’s statistical function library provides comprehensive capabilities for descriptive analysis, from basic central tendency measures through advanced variability assessment and conditional calculations. The Data Analysis ToolPak extends these capabilities with integrated analytical workflows that generate professional statistical summaries suitable for business reporting and decision-making. Understanding both individual function applications and integrated analytical approaches enables efficient, reliable statistical analysis that supports evidence-based business management across diverse professional contexts.
References
ExcelDemy. (2024). How to find mean, median, and mode on Excel: 3 easy methods. ExcelDemy. https://www.exceldemy.com/how-to-find-mean-median-and-mode-on-excel/
Girvin, M. (2024). ExcelIsFun YouTube channel. https://www.youtube.com/@excelisfun
Microsoft Corporation. (2024). Load the Analysis ToolPak in Excel. Microsoft Support. https://support.microsoft.com/en-us/office/load-the-analysis-toolpak-in-excel-6a63e598-cd6d-42e3-9317-6b40ba1a66b4
Microsoft Corporation. (2024). Statistical functions reference. Microsoft Support. https://support.microsoft.com/en-us/office/statistical-functions-reference-624dac86-a375-4435-bc25-76d659719ffd
Statistics How To. (2024). Excel Data Analysis ToolPak: Easy steps. Statistics How To. https://www.statisticshowto.com/excel-data-analysis-toolpak/
