Chapter 4.7: Creating Summary Tables and Initial Statistical Insights
This chapter examines the transformation of individual statistical calculations into systematic summary tables and preliminary business insights. Key concepts include structured approaches to organizing descriptive statistics, framework development for pattern recognition, and systematic documentation strategies that bridge analytical calculations with professional reporting requirements.
Statistical Summary Table Architecture
Effective summary tables organize descriptive statistics into logical structures that support business interpretation and decision-making through consistent formatting, clear variable organization, and appropriate precision levels. Professional summary tables include variable names, sample sizes, measures of central tendency (mean, median), variability measures (standard deviation, range), and relevant additional statistics organized in rows and columns that facilitate comparison and pattern recognition.
Excel Table Construction Methodology: Excel’s table formatting capabilities provide systematic approaches to summary table creation. The Data Tab → Format as Table feature enables professional table structure development with built-in formatting consistency. Table Tools Design Tab offers conditional formatting options that highlight exceptional values automatically. Calculated columns within tables support derived measures such as coefficients of variation (standard deviation divided by mean) that enhance interpretive value.
Table structure follows established conventions that enhance readability and analytical utility. Variables appear as rows with statistics as columns, enabling easy comparison across different measures and identification of patterns that might require further investigation. Appropriate decimal precision (typically 2-3 decimal places for most business metrics) ensures accuracy without overwhelming readers with unnecessary detail.
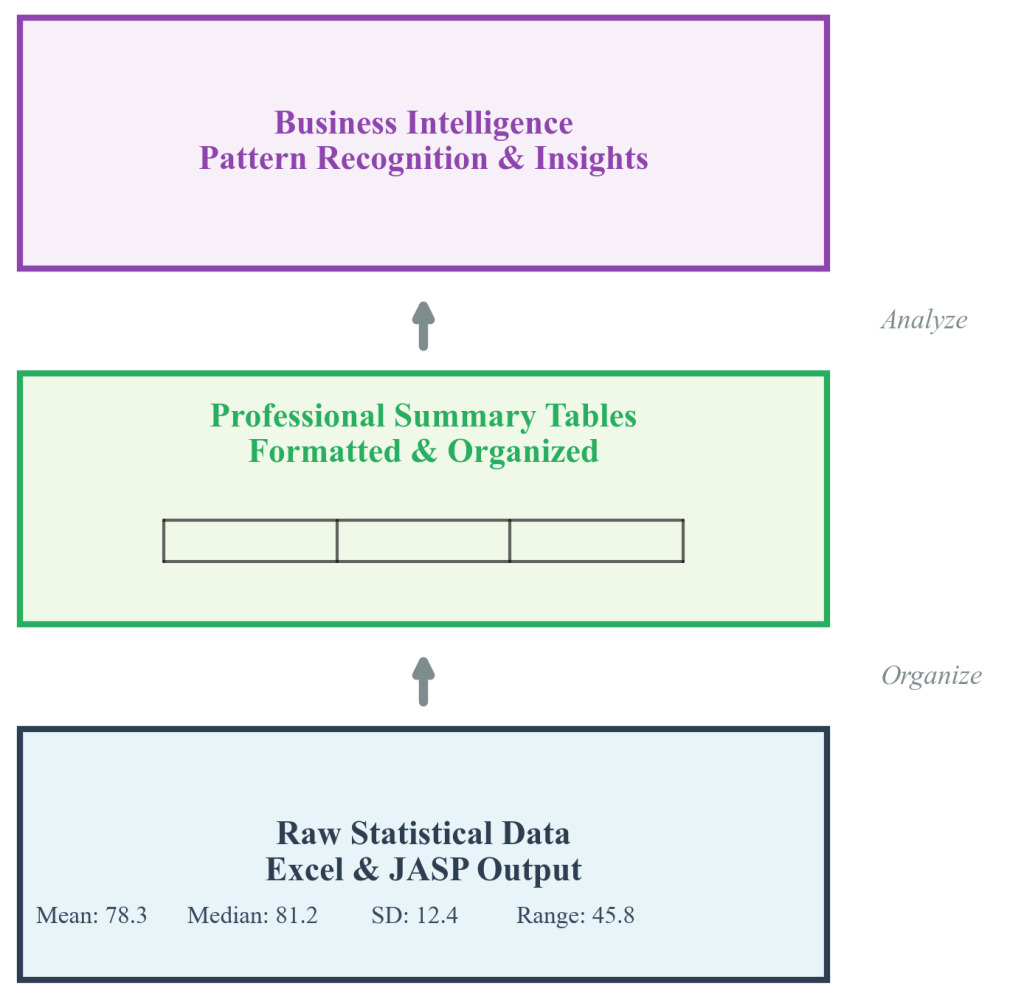
Figure 4.7.1: Three-tier summary table architecture demonstrating the progression from raw statistical calculations through organized summary tables to preliminary business insights. The diagram illustrates systematic organization principles, conditional formatting applications, and insight development processes that transform individual Excel and JASP calculations into coherent analytical narratives suitable for business decision-making.
Advanced table features include conditional formatting that highlights unusual values, calculated columns that show relationships between variables, and summary rows that provide aggregate insights across multiple measures. These enhancements transform basic summary tables into analytical tools that support systematic pattern recognition and business insight development.
MetroRetail Chain Implementation: MetroRetail operates 89 store locations across six metropolitan areas, generating over $420 million annually through diverse product categories including electronics, apparel, and home goods. Regional Performance Manager Sarah Kim’s systematic summary table creation transformed scattered analytical calculations into actionable business intelligence. Standardized summary tables organized statistics by business function, geographic region, and performance category, enabling identification of critical patterns. Cross-location comparisons revealed that stores with mean customer satisfaction above 8.2 out of 10 showed 23% higher sales variability, suggesting that exceptional customer service enabled premium pricing strategies. Metropolitan stores with standard deviations below 0.8 in checkout times consistently outperformed locations with higher variability by 15% in customer retention metrics.
Statistical Pattern Recognition and Insight Development
Systematic insight development transforms numerical statistics into business intelligence through structured interpretation frameworks that connect statistical patterns with operational realities and strategic implications. Effective preliminary insights identify unusual patterns, comparative relationships, and potential explanations that guide subsequent analytical investigation and inform immediate business decisions.
Pattern Recognition Strategies: Comparing means with medians assesses distribution shapes, with means significantly exceeding medians indicating right-skewed distributions where a few high values influence averages. Evaluating standard deviations relative to means identifies consistency issues through coefficients of variation. High coefficients of variation (standard deviation divided by mean) indicate inconsistent performance requiring management attention. Examining ranges detects potential outliers requiring investigation, while systematic comparison across groups reveals patterns that individual variable analysis might miss.
JASP Statistical Analysis Integration: JASP provides comprehensive descriptive statistics outputs that integrate systematically with Excel summary tables. The Descriptive Statistics module generates means, medians, standard deviations, and other measures with publication-quality formatting. JASP’s export capabilities enable direct integration with Excel table structures through copy-paste operations that maintain numerical precision. Quality assurance verification between Excel calculations and JASP output ensures analytical accuracy and builds stakeholder confidence in findings.
Comparative analysis across different groups, time periods, or operational contexts reveals patterns that individual variable analysis might miss. Systematic comparison of summary statistics between high-performing and low-performing units can identify success factors worthy of broader implementation. Temporal comparisons reveal trends that inform forecasting and strategic planning, while geographic or demographic comparisons uncover market opportunities and operational challenges that require targeted interventions.
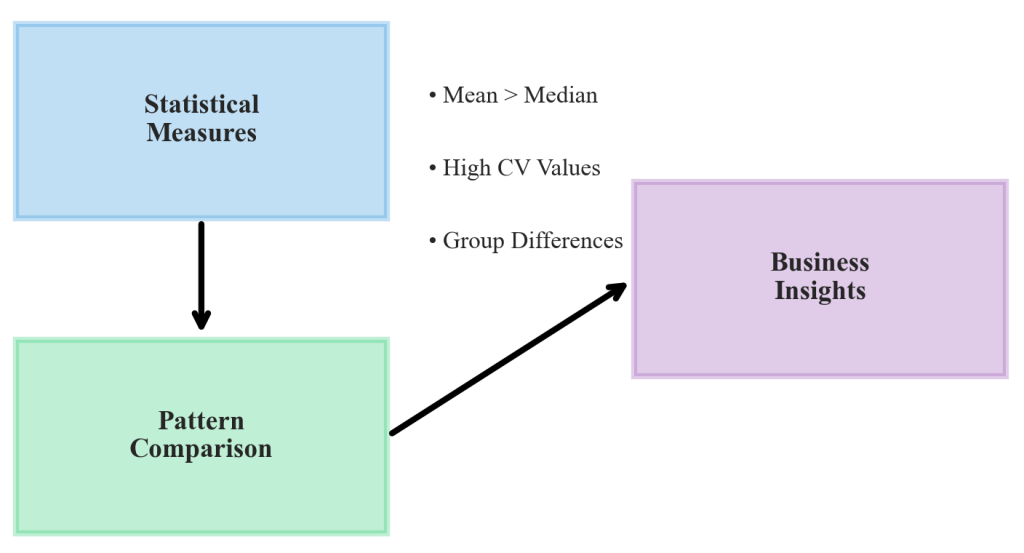
Figure 4.7.2: Systematic framework for transforming statistical patterns into business insights, showing the analytical process from individual statistical measures through comparative analysis to actionable business recommendations. The framework demonstrates how mean-median comparisons, coefficient of variation analysis, and cross-group comparisons generate preliminary insights that guide strategic decision-making and operational improvements.
Professional Implementation and Quality Assurance
Quality enhancement features include conditional formatting that highlights exceptional values, calculated measures that provide additional interpretive context, and summary sections that aggregate findings across multiple variables. Color coding can draw attention to values exceeding predetermined thresholds, while calculated coefficients of variation or other derived measures provide additional interpretive context that supports business decision-making.
Industry Applications: Summary table applications span diverse industry contexts, each requiring specific adaptations to support relevant business decision-making processes. Retail operations use summary tables to organize sales performance, customer satisfaction, and operational efficiency measures across stores, departments, and time periods. Healthcare organizations apply summary table techniques to patient care metrics, operational efficiency measures, and financial performance indicators across departments and service lines. Manufacturing environments utilize summary tables to organize quality control data, production efficiency measures, and cost metrics across production lines, shifts, and time periods.
Documentation strategies include maintaining clear records of data sources, calculation methods, and preliminary interpretations that support analytical transparency and enable quality assurance verification. Systematic organization of findings by business function, geographic region, or temporal period creates logical structures that support advanced reporting workflows and stakeholder communication strategies.
Quality Assurance Procedures: Cross-verification between Excel and JASP calculations provides confidence in numerical accuracy through systematic comparison of means, medians, standard deviations, and other descriptive measures. Documentation of data sources, calculation methods, and preliminary interpretations supports analytical transparency. Systematic review of interpretive statements ensures that insights remain within appropriate bounds given available evidence and analytical scope, preventing premature conclusions that exceed analytical support.
Integration with Analytical Workflows
Summary tables serve as building blocks for comprehensive analytical reporting, creating systematic documentation that supports reproducible analysis and team collaboration. Well-organized preliminary findings enable efficient progression to advanced reporting by providing clear foundation materials, identified patterns requiring deeper investigation, and initial business context that informs appropriate reporting strategies for different stakeholder audiences.
Professional implementation requires adaptation to specific organizational contexts, stakeholder requirements, and decision-making processes. Summary table design should reflect organizational priorities, reporting hierarchies, and strategic objectives while maintaining statistical accuracy and interpretive clarity. Integration with existing reporting systems and analytical workflows ensures that summary table outputs contribute effectively to organizational business intelligence capabilities.
Foundation for Advanced Analysis: The systematic summary table creation and preliminary insight development capabilities establish the foundation for comprehensive analytical reporting and advanced statistical investigation. Organized summary tables provide clear starting points for subsequent analysis phases, while preliminary insights identify specific areas requiring deeper investigation. This systematic approach ensures that analytical workflows progress efficiently from basic descriptive statistics through comprehensive business intelligence applications.
References: Girvin, M. (2024). ExcelIsFun YouTube channel. https://www.youtube.com/@excelisfun; JASP Team. (2024). How to use JASP: JASP on YouTube. JASP Statistics; Microsoft Corporation. (2024). Create and format tables. Microsoft Support; Timbers, T., Campbell, T., & Lee, M. (2024). Data science: A first introduction. https://datasciencebook.ca/
