Chapter 4.8: Distribution Shapes and Data Characteristics
This chapter examines how data distribution patterns reveal underlying business processes and inform analytical decision-making. Key concepts include normal distribution characteristics, skewed pattern recognition, systematic outlier detection methods, and the relationship between distribution shapes and appropriate statistical techniques.
Normal Distributions and Business Applications
Normal distributions represent the most important pattern in statistical analysis, characterized by symmetric, bell-shaped curves where mean, median, and mode converge at the center. This symmetrical pattern indicates that values cluster around a central tendency with decreasing frequency as distance from the center increases, following predictable mathematical relationships that enable powerful statistical inference and business forecasting applications.
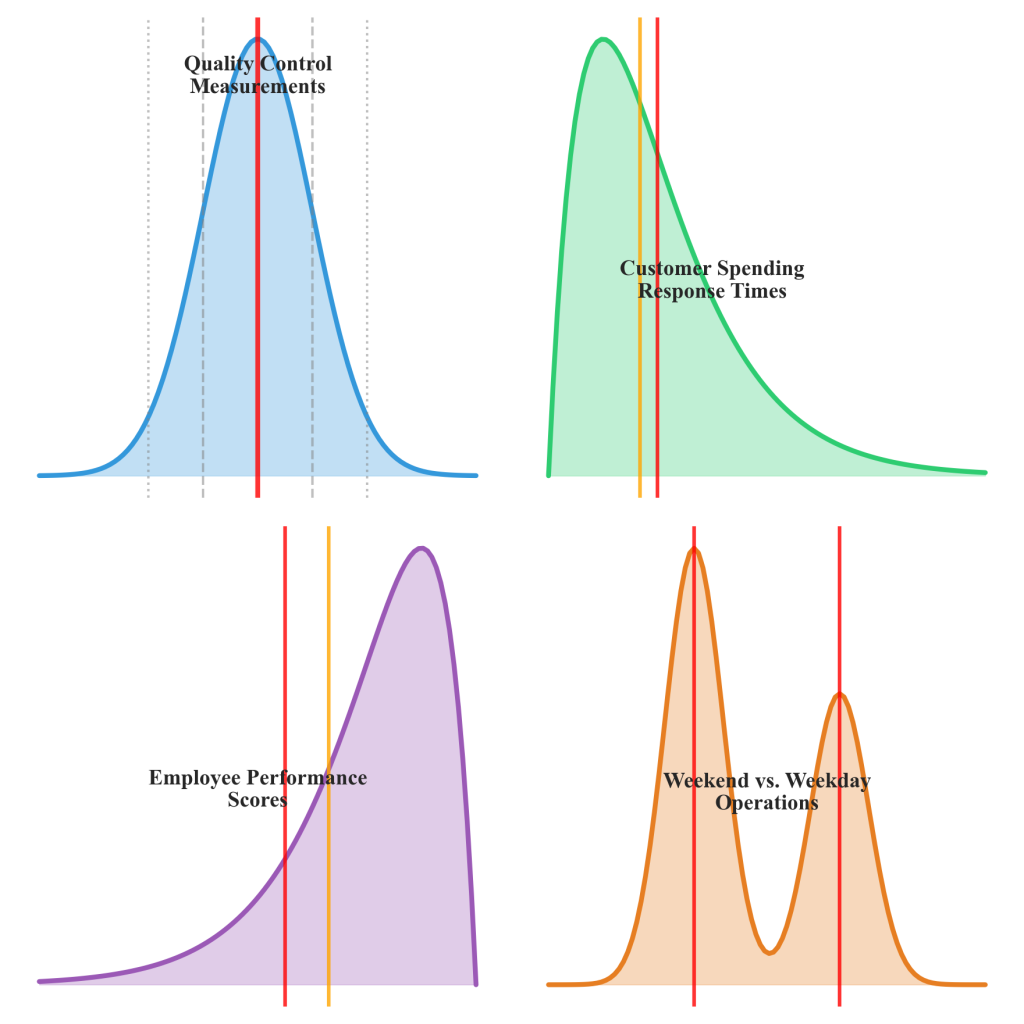
Figure 4.8.1: Comparison of normal, right-skewed, left-skewed, and bimodal distribution patterns commonly observed in business contexts. Each pattern reveals distinct operational characteristics and influences appropriate analytical approaches.
The distinctive characteristics of normal distributions make them readily identifiable through both visual inspection and statistical analysis. The 68-95-99.7 rule provides a practical framework for interpretation: approximately 68% of values fall within one standard deviation of the mean, 95% within two standard deviations, and 99.7% within three standard deviations. This predictability enables reliable forecasting, quality control standards, and risk assessment in business contexts where normal patterns indicate stable, controlled processes.
Excel Distribution Analysis: The Data Analysis ToolPak provides histogram functionality for initial distribution visualization, enabling business analysts to assess symmetry and central tendency patterns. The NORM.DIST function calculates probabilities under normal curves, while descriptive statistics reveal mean-median relationships that indicate distributional shape.
JASP Distribution Assessment: The Descriptive Statistics module offers comprehensive normality testing including Shapiro-Wilk tests, skewness and kurtosis calculations, and Q-Q plots that compare data distributions against theoretical normal patterns. These analytical capabilities enable systematic evaluation of distributional assumptions underlying statistical methods.
Business contexts where normal distributions commonly appear include quality control measurements, employee performance ratings, customer satisfaction scores, and standardized test results. Recognition of normal patterns supports appropriate statistical method selection and enables the application of parametric analytical techniques that assume symmetric, bell-shaped data characteristics.
Skewed Distributions and Asymmetric Patterns
Skewed distributions represent asymmetric patterns where data extends further in one direction than the other, creating characteristic tail formations that reveal underlying business processes and influence appropriate analytical approaches. Right-skewed distributions feature long tails extending toward higher values, while left-skewed distributions show extended tails toward lower values, each indicating different operational dynamics and requiring distinct interpretation strategies.
Right-skewed patterns commonly appear in business contexts involving income distributions, sales figures, website traffic, customer spending, and response times. These distributions reflect natural business boundaries where minimum values are constrained while maximum values can extend indefinitely, creating the characteristic asymmetric shape where most observations cluster near the lower end with progressively fewer cases at higher values.
The relationship between mean and median provides immediate diagnostic information about skewness direction and magnitude. In right-skewed distributions, the mean exceeds the median because extreme high values pull the arithmetic average toward the tail, while the median remains resistant to outlier influence.
Left-skewed distributions occur in contexts where high performance or favorable outcomes cluster near maximum possible values while exceptional low performance creates extended tails. Examples include examination scores in well-prepared populations, customer satisfaction ratings for high-quality services, and equipment reliability measures in mature operational environments.
Systematic Outlier Detection and Investigation
Outliers represent data points that fall substantially outside the typical range of observations, requiring systematic investigation to determine whether they indicate data quality issues, measurement errors, or legitimate extreme cases that provide valuable business insights. Effective outlier detection combines statistical methods with domain knowledge to distinguish between anomalies requiring correction and genuine extreme values that inform business understanding.
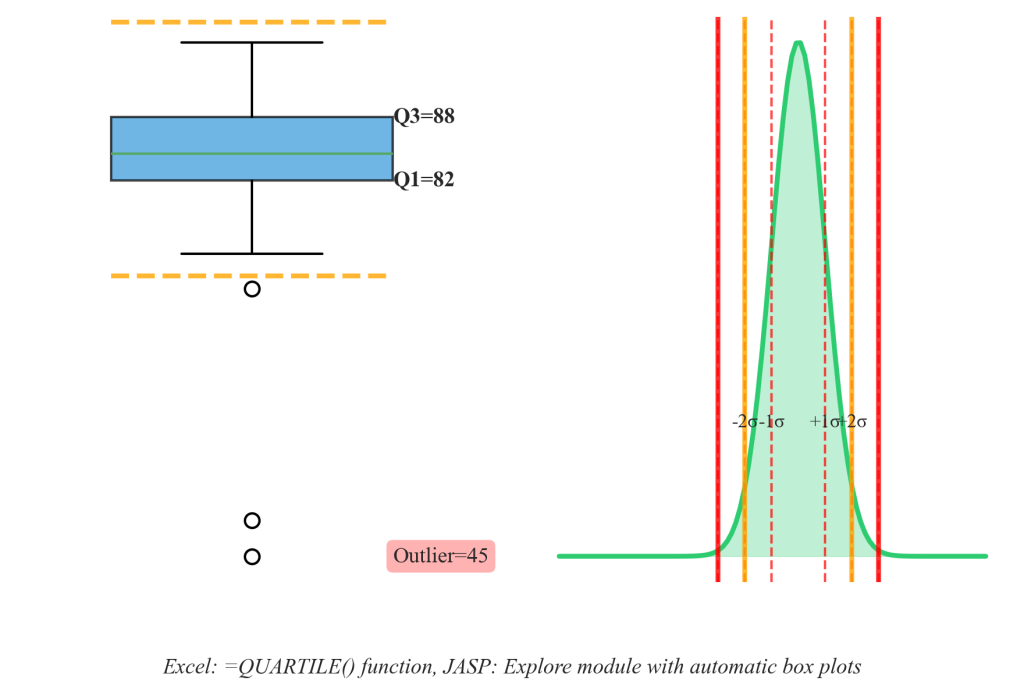
Figure 4.8.2: Comparison of IQR-based and standard deviation-based outlier detection methods, showing box plot boundaries and normal distribution thresholds. The IQR method provides robust detection across different distribution shapes, while standard deviation approaches work best for normal patterns.
The interquartile range (IQR) method provides a robust, distribution-free approach to outlier identification that works effectively across different data shapes and business contexts. Values falling below Q1 – 1.5×IQR or above Q3 + 1.5×IQR are flagged as potential outliers, while extreme outliers exceed Q1 – 3×IQR or Q3 + 3×IQR thresholds.
Excel Outlier Detection: The QUARTILE function enables IQR calculation through =QUARTILE(data_range,3)-QUARTILE(data_range,1), while conditional formatting can highlight values exceeding calculated thresholds. Box and whisker charts automatically identify and display outlier positions for visual analysis.
JASP Outlier Analysis: The Explore module automatically generates box plots that identify and display outlier positions for visual analysis. Descriptive statistics provide exact quartile values and enable systematic threshold calculation for comprehensive outlier assessment.
Standard deviation-based outlier detection works well for approximately normal distributions, identifying values more than two or three standard deviations from the mean as potential anomalies. However, this approach proves less effective for skewed distributions where the standard deviation itself is influenced by extreme values.
Case Study: StreamlineLogistics Distribution Analysis
StreamlineLogistics manages last-mile delivery operations for e-commerce companies across metropolitan regions, processing over 2.4 million package deliveries monthly with a fleet of 8,300 drivers and 47 distribution centers. When Operations Director Michael Chen noticed increasing customer complaints about delivery timing inconsistencies during Q3 2024, traditional performance metrics showed average delivery times within acceptable ranges, yet customers reported unpredictable service that threatened contract renewals worth $89 million annually.
Chen’s analytics team examined delivery time distributions across 18 months of operational data, analyzing over 43 million individual delivery records segmented by geographic zone, time of day, vehicle type, and driver experience levels. Rather than relying solely on summary statistics, they used systematic distribution analysis to visualize and quantify the shape characteristics that revealed underlying operational patterns invisible in traditional reporting.
The distribution analysis revealed dramatically different patterns across operational contexts. Urban core deliveries followed a tight, approximately normal distribution centered around 2.8 hours with a standard deviation of 0.7 hours, indicating consistent, predictable service. However, suburban zone deliveries showed a strongly right-skewed distribution with mean delivery time of 5.1 hours but median of 4.2 hours, indicating that while most deliveries occurred within reasonable timeframes, a substantial tail of delayed deliveries created negative customer experiences.
Most significantly, weekend delivery patterns revealed a bimodal distribution with peaks at 3.5 hours and 7.8 hours, suggesting two distinct operational modes rather than a single coherent process. Investigation revealed that weekend shifts operated with different staffing models that created the dual-peak pattern making service timing unpredictable for customers. Armed with distribution-based insights, Chen implemented targeted operational improvements that reduced delivery time variability by 34% and increased customer satisfaction scores from 3.8 to 4.6 out of 5.0.
Distribution Shape and Statistical Method Selection
Distribution shape characteristics directly influence appropriate statistical method selection and analytical approach determination. Normal distributions support parametric statistical methods including t-tests, ANOVA, and regression analysis that assume symmetric, bell-shaped data patterns. These methods provide powerful analytical capabilities when distributional assumptions are satisfied, enabling reliable hypothesis testing and confidence interval estimation.
Skewed distributions often require non-parametric methods or data transformation techniques to achieve analytical objectives. Non-parametric approaches include median-based comparisons, rank-based tests, and distribution-free confidence intervals that remain valid regardless of underlying distribution shape. Transformation techniques such as logarithmic or square root transformations may normalize skewed data for parametric analysis while preserving meaningful business interpretation.
Systematic outlier investigation requires examining context, timing, and potential causes rather than automatically removing unusual values, as legitimate outliers often provide the most valuable business insights representing exceptional performance, emerging trends, or process variations that require management attention.
Business Applications Across Industry Contexts
Distribution shape recognition supports diverse industry applications, each requiring specific adaptations to organizational contexts and decision-making requirements. E-commerce analytics applications include customer order value analysis where right-skewed patterns reveal purchasing behavior segmentation, website traffic analysis where normal patterns indicate stable user engagement, and conversion rate assessment where distribution shapes inform marketing strategy optimization.
Healthcare operations utilize distribution analysis for patient care metrics where normal vital sign distributions indicate healthy populations, right-skewed hospital stay distributions reveal complex case management requirements, and outlier detection in treatment outcomes supports quality assurance and risk management protocols.
Financial services applications encompass credit score analysis where normal distributions support risk assessment modeling, account balance analysis where right-skewed patterns inform product development and pricing strategies, and transaction pattern analysis where outlier detection supports fraud prevention and customer security measures.
Manufacturing environments apply distribution analysis to quality control where normal measurement distributions indicate controlled processes, defect rate analysis where right-skewed patterns reveal process improvement opportunities, and equipment performance monitoring where outlier detection supports predictive maintenance and operational efficiency optimization.
Key Concepts and Synthesis
This chapter established the fundamental principles of distribution shape recognition and their applications in business analytics. Normal distributions provide the foundation for parametric statistical analysis and indicate stable, controlled processes in organizational contexts. Skewed patterns reveal natural business boundaries and asymmetric operational characteristics that require specialized analytical approaches.
Systematic outlier detection through IQR and standard deviation methods enables the identification of anomalies that may represent data quality issues or valuable extreme observations requiring investigation. The choice of detection method should align with underlying distribution characteristics and business context requirements.
Understanding distribution shapes and their business implications prepares analysts to select appropriate statistical methods, interpret analytical results correctly, and communicate findings effectively to stakeholders. These pattern recognition skills form essential foundations for advanced statistical analysis and data-driven decision-making in organizational contexts.
References
Irizarry, R. A. (2024). Introduction to data science: Data wrangling and visualization with R. Harvard University. https://rafalab.dfci.harvard.edu/dsbook-part-1/
JASP Team. (2024). JASP user manual: Descriptive statistics and distribution analysis. University of Amsterdam. https://jasp-stats.org/jasp-materials/
Microsoft Corporation. (2024). Create a histogram. Microsoft Excel Help Center. https://support.microsoft.com/en-us/office/create-a-histogram-85680173-064b-4024-b4d6-ce8f37de5e90
Timbers, T., Campbell, T., & Lee, M. (2024). Data science: A first introduction. University of British Columbia. https://datasciencebook.ca/
