Chapter 4.9: Pattern Recognition and Relationship Identification
This chapter examines systematic approaches to recognizing relationships and anomalies in datasets through correlation analysis, scatter plot interpretation, and cross-tabulation techniques. Key concepts include linear relationship measurement, visual pattern recognition, and categorical variable association analysis that transform individual variable knowledge into understanding of business relationships and interdependencies.
Understanding Correlation Analysis: Measuring Relationship Strength
Correlation analysis quantifies the strength and direction of linear relationships between two continuous variables, providing essential insights into how business metrics influence each other. The Pearson correlation coefficient ranges from -1 to +1, where values near +1 indicate strong positive relationships, values near -1 indicate strong negative relationships, and values near 0 suggest no linear relationship.
Excel Correlation Analysis Implementation
The Excel CORREL() function calculates correlation coefficients efficiently using the syntax =CORREL(array1, array2). The Data Analysis ToolPak provides comprehensive correlation matrix capabilities for multiple variable analysis. These tools enable systematic relationship discovery across complex datasets through standardized analytical procedures.
Business applications of correlation analysis span virtually every analytical context where understanding relationships drives strategic decisions. Marketing teams use correlation to identify which promotional activities correlate with sales increases, while operations managers examine relationships between process variables and quality outcomes. Financial analysts investigate correlations between market indicators and performance metrics, enabling data-driven investment and resource allocation decisions that improve organizational effectiveness.
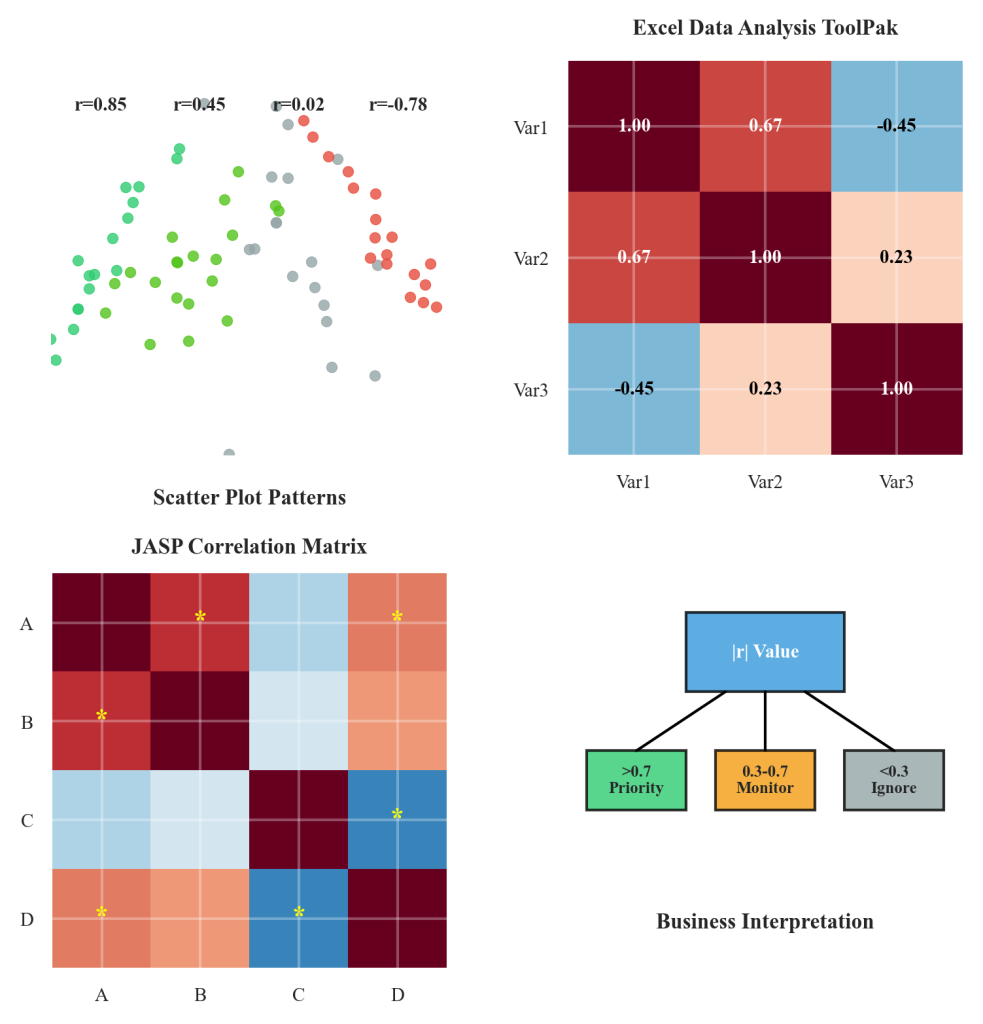
Figure 4.9.1: Four-panel correlation analysis workflow demonstrating systematic relationship discovery in business contexts. Panel 1 shows scatter plot patterns for different correlation strengths, Panel 2 illustrates Excel Data Analysis ToolPak implementation, Panel 3 displays JASP correlation matrix visualization, and Panel 4 presents business interpretation decision framework linking correlation strength to strategic actions.
Effective correlation interpretation requires understanding both statistical significance and practical business relevance. Strong correlations (|r| > 0.7) suggest variables that move together predictably, indicating potential cause-effect relationships worthy of detailed investigation. Moderate correlations (0.3 ≤ |r| ≤ 0.7) reveal relationships that merit monitoring and further analysis, while weak correlations (|r| < 0.3) suggest variables that operate independently and require separate management strategies.
TechAdvantage Solutions: Systematic Relationship Analysis Case Study
TechAdvantage Solutions operates a Software-as-a-Service platform serving 24,000 business customers across North America, generating $147 million annually through subscription services, consulting, and premium feature upgrades. When Chief Revenue Officer Jennifer Walsh noticed quarterly revenue growth slowing from 18% to 6% during 2024, traditional reporting showed individual metrics like customer count, average subscription price, and support ticket volume moving in expected directions. However, Walsh suspected that understanding relationships between these metrics might reveal hidden revenue drivers that aggregate reporting missed.
The challenge stemmed from TechAdvantage’s siloed analytical approach that examined each business metric independently without investigating how customer behaviors, product usage patterns, and operational factors influenced each other. While customer satisfaction scores averaged 8.1 out of 10 and support response times met 4-hour targets, revenue per customer showed concerning variability that threatened growth projections.
Walsh commissioned Senior Analytics Manager Michael Rodriguez to conduct comprehensive bivariate analysis across customer data spanning 18 months of operational metrics. The analysis examined relationships between customer demographics, product usage patterns, support interactions, subscription features, payment behaviors, and revenue outcomes. Rather than reviewing metrics individually, Rodriguez implemented systematic correlation analysis to identify which variables moved together and how strongly those relationships influenced business outcomes.
Key Analytical Findings
The correlation analysis revealed unexpected business insights hidden within traditional reporting approaches. Customer support ticket frequency showed a surprising positive correlation (r = 0.67) with monthly revenue per customer, suggesting that engaged customers who actively used support services generated higher value rather than creating cost burdens. Geographic analysis revealed that customers in technology hubs generated 31% higher revenue and showed stronger correlations between feature usage and subscription upgrades (r = 0.74) compared to traditional markets (r = 0.41).
Most significantly, systematic relationship analysis uncovered a strong negative correlation (r = -0.83) between initial onboarding completion time and long-term customer lifetime value. Customers who completed setup within 48 hours averaged $2,400 annual revenue compared to $1,100 for those requiring extended onboarding periods. Cross-tabulation analysis revealed that premium feature adoption correlated strongly with specific industry segments, with healthcare and financial services customers showing 3.2x higher upgrade rates than retail or manufacturing segments.
The pattern recognition process identified temporal relationships that proved crucial for revenue optimization. Customer engagement scores during months 2-4 showed correlations of r = 0.79 with 12-month retention rates, enabling predictive identification of at-risk customers months before churn typically occurred. Support interaction quality scores correlated strongly with subsequent subscription upgrades (r = 0.68), indicating that excellent service drove expansion revenue rather than simply maintaining existing relationships.
Strategic Implementation Results
Armed with systematic relationship insights, Walsh implemented targeted strategies that leveraged discovered patterns rather than addressing individual metrics independently. Enhanced onboarding programs reduced setup time by 67% while support teams received training to recognize engagement opportunities that historically preceded revenue expansion. Industry-specific feature marketing increased premium adoption by 43% among high-correlation segments. Within seven months, these relationship-driven interventions increased quarterly revenue growth to 14% while improving customer satisfaction scores to 8.7, demonstrating how understanding variable relationships transforms operational strategy from reactive management into proactive revenue optimization.
Creating and Interpreting Scatter Plots for Visual Pattern Recognition
Scatter plots provide powerful visual representations of relationships between variables, enabling pattern recognition that complements numerical correlation analysis. These visualizations reveal linear relationships, curved patterns, outlier observations, and heteroscedasticity that correlation coefficients alone might miss. Adding trendlines and R-squared values to scatter plots provides additional insights into relationship strength and predictive capability.
Excel Scatter Plot Implementation
Excel’s scatter chart functionality creates professional visualizations through the Insert Chart menu, selecting Scatter plot options with or without connecting lines. Trendline addition requires right-clicking data points and selecting “Add Trendline,” with R-squared display options available in Format Trendline settings. These features enable comprehensive visual analysis of variable relationships.
Systematic scatter plot interpretation follows established patterns that inform business decision-making. Upward-sloping point clusters indicate positive relationships where increases in one variable associate with increases in another, while downward-sloping patterns suggest negative relationships where one variable decreases as another increases. Tight clustering around trendlines indicates strong, predictable relationships, while scattered point distributions suggest weak or nonlinear associations requiring different analytical approaches.
Advanced scatter plot techniques enhance pattern recognition capabilities through strategic use of color coding, point sizing, and categorical groupings. Business analysts can encode third variables through point colors that reveal how categorical factors influence relationships, or use point sizes to represent magnitude variables that add analytical depth. These visualization enhancements enable multivariate pattern recognition that supports sophisticated business insight development and strategic planning initiatives.
Cross-Tabulation Analysis for Categorical Variable Relationships
Cross-tabulation provides systematic analysis of relationships between categorical variables, revealing patterns and associations that correlation analysis cannot detect. This analytical approach proves essential for understanding customer segments, product preferences, and operational categorizations that drive business performance.
Excel PivotTable Cross-Tabulation Implementation
Excel’s PivotTable functionality creates comprehensive cross-tabulation summaries by placing categorical variables in row and column areas of the PivotTable design. Chi-square test calculations require Excel’s Data Analysis ToolPak or manual implementation using CHISQ.TEST function. These tools enable systematic categorical relationship analysis with statistical validation capabilities.
Professional cross-tabulation analysis examines both frequency distributions and percentage breakdowns that reveal meaningful business patterns. Row percentages show how categories within one variable distribute across categories of another variable, while column percentages reveal the reverse perspective. These dual analytical views enable comprehensive understanding of categorical relationships that inform market segmentation, product positioning, and operational optimization strategies.
JASP Statistical Validation
JASP’s contingency table analysis extends cross-tabulation capabilities through sophisticated statistical testing that validates relationship significance. Chi-square tests, Fisher’s exact tests, and Cramér’s V calculations provide statistical evidence for categorical associations, while standardized residuals identify specific category combinations that contribute most strongly to overall relationship patterns. These advanced features support evidence-based business decision-making that relies on statistically validated insights rather than observational impressions.
Systematic Approaches to Multivariate Pattern Discovery
Effective pattern recognition requires systematic exploration strategies that balance comprehensive coverage with analytical efficiency. The correlation matrix approach examines all possible variable pairs simultaneously, revealing complex relationship networks that univariate analysis cannot detect.
Excel Data Analysis ToolPak Matrix Generation
Excel’s Data Analysis ToolPak generates correlation matrices for multiple variables efficiently through the Correlation tool. The process requires organizing data in adjacent columns with variable headers, selecting the Correlation option from Data Analysis menu, and specifying input range including labels. Output options include matrix placement and significance level specifications.
Progressive relationship analysis builds understanding systematically by starting with strongest correlations and expanding to examine moderate relationships that might reveal important secondary patterns. This approach prevents analytical overwhelm while ensuring that critical business relationships receive appropriate attention. Documentation of correlation findings enables team collaboration and supports reproducible analysis workflows that maintain quality standards across different analytical contexts and organizational requirements.
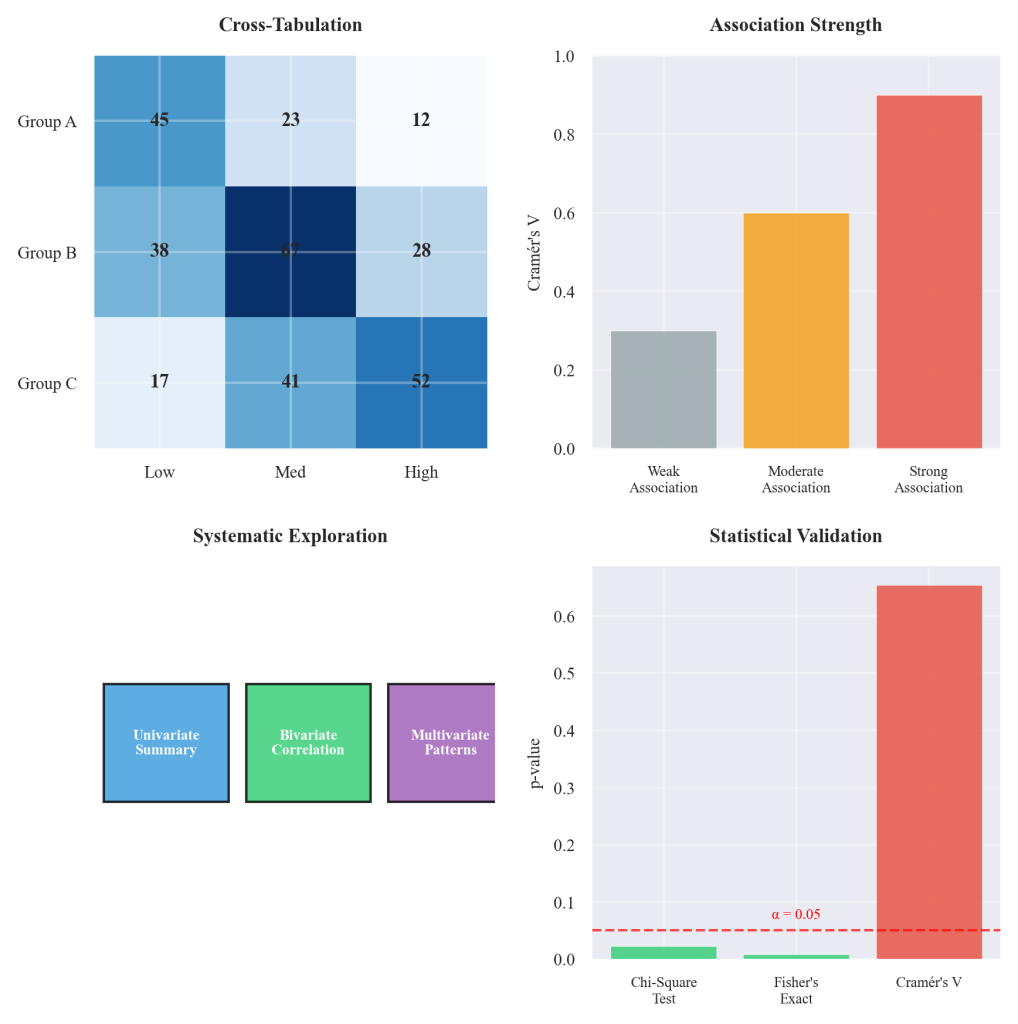
Figure 4.9.2: Advanced pattern recognition techniques for multivariate relationship discovery. The diagram illustrates systematic approaches to cross-tabulation analysis, categorical relationship assessment, and progressive exploration strategies that enable comprehensive business intelligence development through statistical validation methods.
Integration of correlation analysis with central tendency and variability measures provides comprehensive understanding of dataset characteristics that informs appropriate analytical approaches. Variables with strong correlations but high variability might require different management strategies than variables with moderate correlations and low variability. This integrated understanding enables sophisticated analytical decision-making that considers multiple statistical perspectives simultaneously rather than relying on single measures that might provide incomplete business insights.
JASP Comprehensive Correlation Analysis
JASP provides enhanced matrix visualization through heatmaps and significance testing that supports large-scale relationship discovery. The correlation analysis module offers confidence interval estimation, multiple comparison corrections, and publication-quality output formatting. These capabilities enable professional statistical analysis that meets academic and industry standards for relationship validation and reporting.
Key Concepts Summary
Pattern recognition and relationship identification represent fundamental analytical capabilities that transform individual variable knowledge into understanding of complex business interdependencies. Correlation analysis provides quantitative measurement of linear relationships, while scatter plots enable visual pattern recognition that complements numerical analysis. Cross-tabulation extends relationship analysis to categorical variables, revealing market segments and operational patterns that drive organizational performance.
Systematic approaches to multivariate pattern discovery ensure comprehensive relationship exploration while maintaining analytical efficiency. These methodologies support evidence-based business decision-making that leverages statistical validation rather than observational impressions, enabling organizations to identify hidden revenue drivers and operational optimization opportunities that traditional aggregate reporting cannot reveal.
References
Adhikari, A., DeNero, J., & Wagner, D. (2022). Computational and inferential thinking: The foundations of data science (2nd ed.). https://inferentialthinking.com/
Irizarry, R. A. (2024). Introduction to data science: Data wrangling and visualization with R. https://rafalab.dfci.harvard.edu/dsbook-part-1/
JASP Team. (2024). JASP user manual: Correlation analysis and regression. https://jasp-stats.org/jasp-materials/
Microsoft Corporation. (2024). Statistical functions reference. https://support.microsoft.com/en-us/office/statistical-functions-reference-624dac86-a375-4435-bc25-76d659719ffd
Timbers, T., Campbell, T., & Lee, M. (2024). Data science: A first introduction. https://datasciencebook.ca/
