Chapter 6.3: T-Tests for Mean Comparisons
This chapter examines t-test procedures for comparing sample means to population parameters or between groups while accounting for sampling variability. T-tests enable researchers to distinguish genuine differences from random variation, providing quantified confidence levels for organizational decision-making through one-sample, independent samples, and paired comparison methodologies.
Statistical Foundation of T-Tests
T-tests are statistical procedures that compare sample means to population parameters or between groups while accounting for sampling variability through the t-distribution. These tests enable researchers to distinguish genuine differences from random variation in data, providing quantified confidence levels for decision-making processes across organizational and research contexts.
The statistical foundation utilizes the t-distribution, which approximates the normal distribution but includes additional variability to account for uncertainty when population standard deviations are unknown. The t-distribution becomes increasingly similar to the normal distribution as sample sizes increase, reflecting the reduced uncertainty that accompanies larger samples. This mathematical framework enables statistical inference about population parameters based on sample statistics while maintaining appropriate Type I error rates.
Industry Application: A major Dutch fast-moving consumer goods retailer implemented rigorous statistical analysis to evaluate €2.5 million in annual staff training investments. Their People Analytics team designed an A/B testing study involving 100 retail outlets, with 50 stores receiving comprehensive training and 50 control stores continuing standard operations. The study demonstrated training effectiveness through t-test analysis, revealing significant differences in monthly sales revenue and establishing a 400% first-year return on investment.
One-Sample T-Tests
One-sample t-tests compare a sample mean to a known population value or theoretical standard, testing whether observed data differs significantly from an expected benchmark. The procedure calculates a t-statistic by dividing the difference between the sample mean and hypothesized population mean by the standard error of the sample mean, enabling organizations to evaluate whether performance meets established standards or regulatory requirements.
The statistical logic compares sample means to hypothesized population means using the t-distribution framework. Microsoft Corporation evaluated whether employee performance scores following digital skills training (M = 82.3, SD = 12.4, n = 45) significantly exceeded the historical company average of 78.5 points. The one-sample t-test revealed t(44) = 2.58, p = 0.013, indicating statistical significance with Cohen’s d = 0.39 representing a medium effect size.
Statistical assumptions include normal distribution of the dependent variable, independence of observations, and measurement at the interval or ratio level. Violations of normality assumptions can be addressed through data transformation or non-parametric alternatives, while independence violations require methodological adjustments such as clustered analysis approaches or hierarchical modeling procedures.
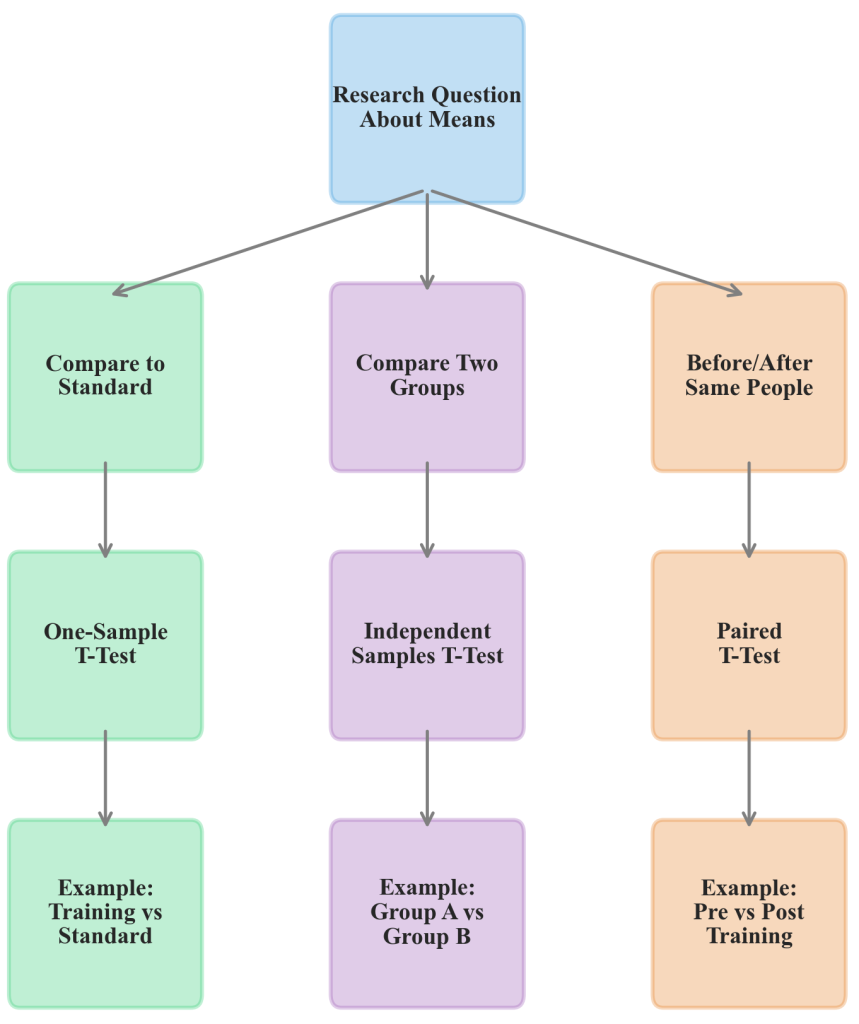
Figure 6.3.1: Decision framework for selecting appropriate t-test variants based on research questions and data characteristics. The flowchart illustrates decision points for choosing between one-sample, independent samples, and paired t-tests, including key assumptions and business application scenarios.
Independent Samples T-Tests
Independent samples t-tests compare means between two separate, unrelated groups to determine whether observed differences represent genuine population differences rather than sampling variation. This procedure assumes equal variances between groups, though robust variants like Welch’s t-test accommodate unequal variance situations without compromising statistical validity for business applications.
Statistical Mechanics: Independent samples t-tests pool variance estimates from both groups to create more stable standard error estimates, assuming homogeneity of variance. When this assumption is violated, Welch’s correction adjusts the degrees of freedom calculation to maintain appropriate Type I error rates while preserving statistical power for detecting genuine effects. Modern statistical software automatically provides both equal and unequal variance results.
The Dutch FMCG retailer case study demonstrates practical application where 100 retail outlets were randomly assigned to training (n = 50) or control (n = 50) conditions. Independent samples t-test analysis revealed significant differences in monthly sales revenue between trained stores (M = €487,000, SD = €45,000) and control stores (M = €398,000, SD = €52,000), with t(98) = 9.23, p < 0.001, and Cohen’s d = 0.89 representing a large effect size with substantial practical significance.
The retail study’s statistical rigor enabled the company to project annual additional revenue of €21.4 million from training implementation across all outlets. The large effect size provided confidence that observed differences represented substantial practical significance beyond mere statistical significance, supporting executive leadership decisions to expand training programs company-wide while establishing evidence-based standards for future workforce development investments.
Paired T-Tests
Paired t-tests analyze differences between two measurements on the same individuals, eliminating individual variation as a source of error variance while focusing analysis specifically on the intervention or time effect. This within-subjects design provides increased statistical power for detecting changes compared to between-subjects approaches, particularly when individual differences are substantial relative to treatment effects.
The statistical advantage emerges from calculating difference scores for each individual, then testing whether the mean difference differs significantly from zero using a one-sample t-test framework. This approach controls for baseline individual characteristics that might otherwise obscure treatment effects in between-group comparisons, making paired designs particularly valuable for training evaluation and longitudinal organizational studies.
Power Analysis Considerations: Paired designs typically require smaller sample sizes than independent group designs to detect equivalent effect sizes, making them particularly valuable for expensive or logistically challenging studies. The correlation between pre- and post-measurements directly influences the power advantage, with higher correlations providing greater benefits from paired design approaches in organizational research contexts.
JASP Implementation and Statistical Output
JASP software provides comprehensive t-test implementation through intuitive menu navigation that supports professional analysis standards while maintaining accessibility for business applications. One-sample tests are accessed through T-Tests > One Sample T-Test, independent samples comparisons via T-Tests > Independent Samples T-Test, and paired analyses using T-Tests > Paired Samples T-Test menu options.
JASP T-Test Procedures:
• Navigate to T-Tests menu for analysis selection
• Configure variables using drag-and-drop interface
• Enable Confidence intervals for parameter estimation
• Select Effect size calculations for practical significance
• Activate Descriptive statistics for comprehensive reporting
• Utilize Assumption Checks for validity assessment
• Generate Descriptives plots for business communication
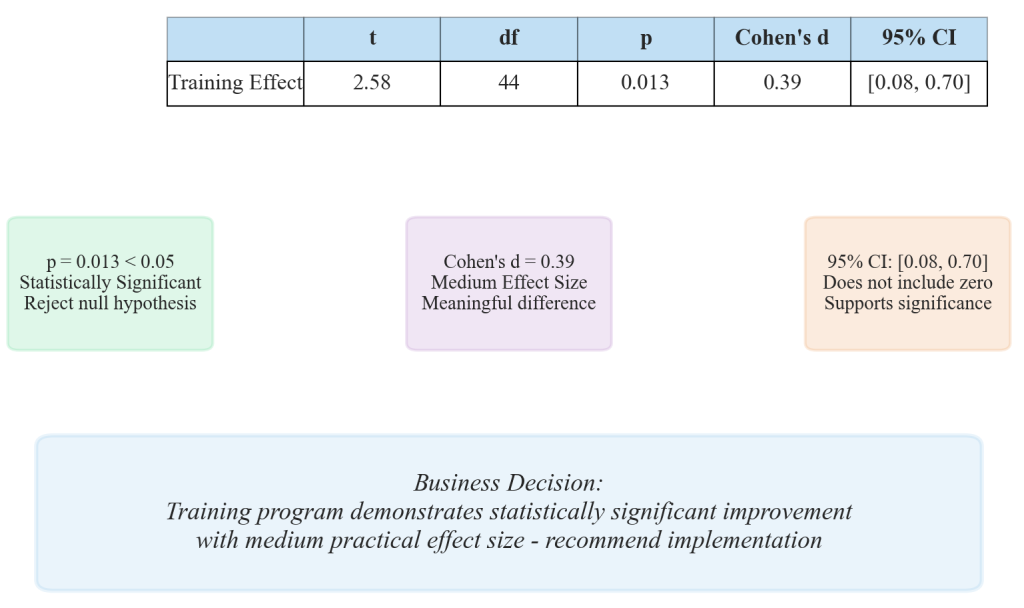
Figure 6.3.2: Comprehensive guide to interpreting JASP t-test output elements including p-values for statistical significance, confidence intervals for population parameter estimation, and Cohen’s d effect sizes for practical significance evaluation. Annotations highlight business decision-making implications of statistical results.
Critical output interpretation focuses on p-values for statistical significance testing, confidence intervals for population parameter estimation, and effect sizes like Cohen’s d for practical significance evaluation. The software automatically provides assumption checking through normality tests and equality of variances assessments, while visualization options support professional business communication requirements.
Effect Size Interpretation and Practical Significance
Cohen’s d serves as the standard effect size measure for t-tests, representing the standardized difference between means in standard deviation units. Conventional interpretation guidelines suggest d = 0.2 indicates small effects, d = 0.5 represents medium effects, and d = 0.8 constitutes large effects, though practical significance depends heavily on the specific organizational context and domain application.
Effect sizes provide crucial information beyond statistical significance testing, enabling researchers to evaluate the practical importance of observed differences for business decision-making. In organizational contexts, even small effect sizes may represent substantial economic impact when applied across large populations or extended time periods, while large effect sizes in small studies may lack generalizability to broader operational contexts.
Business Context Integration: Statistical significance testing must be complemented by practical significance evaluation through effect size analysis and confidence interval interpretation. Organizations should establish domain-specific guidelines for meaningful effect sizes based on operational costs, implementation feasibility, and strategic objectives rather than relying solely on conventional statistical interpretation frameworks.
Assumption Validation and Robustness
T-test procedures require several key assumptions for valid statistical inference, including normality of the dependent variable, independence of observations, and appropriate measurement scales. Normality assumptions can be assessed through visual inspection of histograms and Q-Q plots, supplemented by formal tests such as Shapiro-Wilk or Kolmogorov-Smirnov procedures available through statistical software.
Independence of observations represents a design consideration that cannot be statistically tested but must be ensured through appropriate sampling and experimental procedures. Equal variance assumptions in independent samples t-tests can be evaluated using Levene’s test or F-test procedures, with violations addressed through Welch’s t-test or other robust alternatives that maintain statistical validity without compromising analytical rigor.
Modern statistical software automatically provides both equal and unequal variance results, enabling researchers to select appropriate interpretations based on assumption checking outcomes. Bootstrap procedures and permutation tests offer alternative approaches that relax distributional assumptions while maintaining the intuitive interpretation framework that makes t-tests valuable for practical organizational decision-making processes.
Contemporary Applications and Integration
T-tests remain fundamental tools in organizational research, clinical trials, and business analytics despite the availability of more sophisticated statistical procedures. Their interpretive simplicity and robust performance under moderate assumption violations make them particularly valuable for communicating results to non-technical stakeholders while maintaining statistical rigor required for evidence-based organizational decision-making.
Integration with modern data analysis workflows often combines t-tests with exploratory data analysis, effect size calculations, and confidence interval estimation to provide comprehensive statistical summaries. Contemporary applications leverage automated assumption checking, robust variants for assumption violations, and effect size interpretation frameworks that support both statistical and practical significance evaluation in organizational contexts.
The Dutch retailer case study exemplifies contemporary t-test applications where statistical rigor supports strategic business decisions. The combination of appropriate research design, rigorous statistical analysis, and practical significance interpretation enabled evidence-based workforce development investments with quantified return on investment projections, demonstrating how classical statistical procedures continue to provide value in modern organizational analytics.
References
Adhikari, A., DeNero, J., & Wagner, D. (2022). Computational and inferential thinking: The foundations of data science (2nd ed.). Available online: https://inferentialthinking.com/
Cohen, J. (1988). Statistical power analysis for the behavioral sciences (2nd ed.). Lawrence Erlbaum Associates.
Irizarry, R. A. (2024). Statistics and prediction algorithms through case studies (Volume 2). Available online: https://rafalab.dfci.harvard.edu/dsbook-part-2/
JASP Team. (2024). JASP statistical software (Version 0.18.3) [Computer software]. https://jasp-stats.org/
Timbers, T., Campbell, T., & Lee, M. (2024). Data science: A first introduction. Available online: https://datasciencebook.ca/
