Chapter 6.5: Simple Linear Regression and Prediction Modeling
This chapter examines simple linear regression as a fundamental predictive modeling technique that transforms correlation insights into quantitative forecasting capabilities. Key concepts include regression equation interpretation, model evaluation through diagnostic measures, and systematic implementation using statistical software for business applications.
Theoretical Foundation and Mathematical Framework
Simple linear regression extends correlation analysis by creating predictive models that quantify systematic relationships between variables, enabling forecasting and causal hypothesis testing through mathematical modeling approaches. The regression equation Y = a + bX transforms relationship insights into practical prediction tools, where the slope coefficient (b) indicates expected change in the outcome variable for each unit change in the predictor variable, and the intercept (a) represents the predicted outcome value when the predictor equals zero.
Linear Regression Model: The mathematical relationship Y = a + bX quantifies how systematic variation in the predictor variable explains systematic variation in the outcome variable. This framework enables precise prediction and quantification of relationship strength beyond simple correlation analysis.
The connection between correlation and regression strengthens both analytical approaches and supports appropriate method selection for different research questions. Strong correlations typically produce meaningful regression models, but regression analysis provides additional insights including prediction intervals, residual analysis, and statistical inference testing that correlation analysis alone cannot deliver. The coefficient of determination (R²) directly relates to correlation strength, as R² equals the squared correlation coefficient and indicates the proportion of outcome variance explained by the predictor variable.
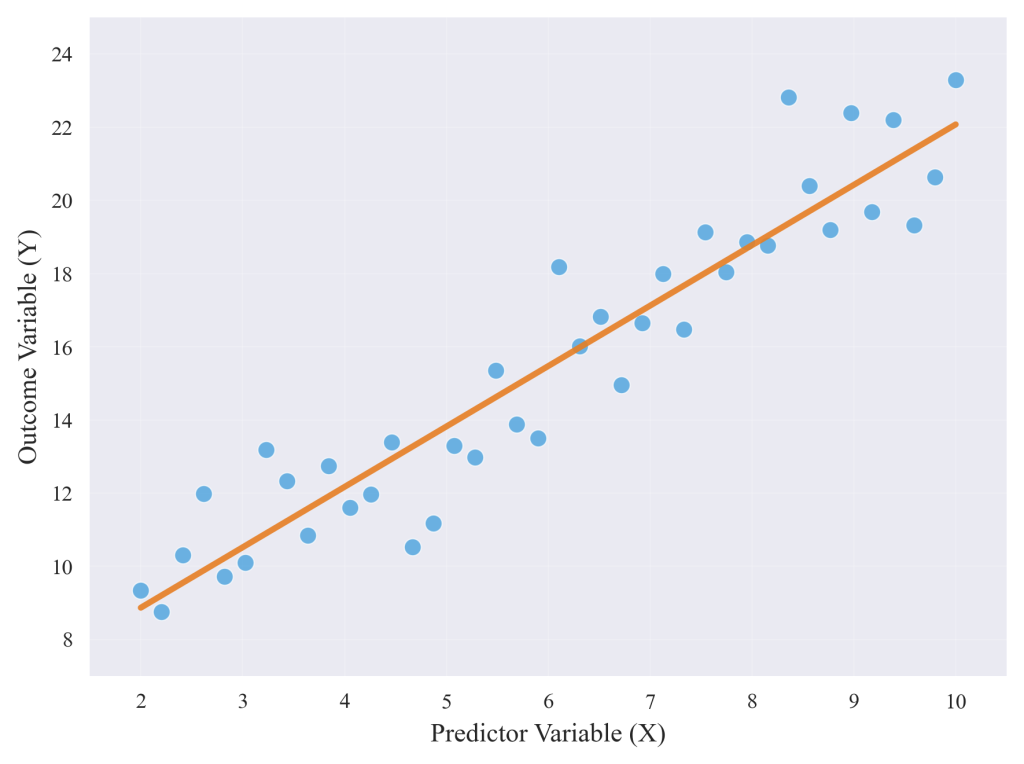
Figure 6.5.1: Simple linear regression demonstrates the mathematical relationship between predictor and outcome variables through a fitted line that minimizes prediction errors. The visualization shows how individual data points cluster around the regression line, with the slope indicating the rate of change and the intercept representing the baseline value.
Regression Equation Interpretation and Business Applications
The regression equation provides the mathematical foundation for transforming statistical relationships into quantitative predictions through systematic interpretation of coefficients, intercepts, and model fit measures. The slope coefficient represents the critical interpretation element, quantifying expected change in the outcome variable for each one-unit increase in the predictor variable while holding all other factors constant. This coefficient enables direct calculation of impact scenarios and quantified relationship assessment across various application domains.
Coefficient Interpretation: The slope coefficient (b) in the regression equation Y = a + bX represents the average change in Y associated with a one-unit increase in X. This quantification enables direct prediction calculations and strategic impact assessment.
Interpreting regression results requires attention to both statistical significance and practical significance, ensuring that model coefficients represent both mathematically reliable relationships and meaningful magnitudes of effect. Statistical significance testing (p-values) indicates whether observed relationships are likely due to genuine population effects rather than random sampling variation, while practical significance evaluation considers whether coefficient magnitudes represent economically or scientifically meaningful impacts worth considering for decision-making applications.
Applied Example: SaaS Revenue Prediction
TechFlow Solutions implemented regression analysis to predict monthly recurring revenue from customer engagement metrics. The analysis utilized 18 months of data across 6,120 customer-month observations, with engagement scores ranging from 2.1 to 9.7 on a 10-point scale. The regression model achieved R² = 0.743 with a coefficient of $4,187 per engagement point (95% CI: $3,842 – $4,532, p < 0.001), indicating strong predictive capability.
The model enabled systematic revenue forecasting with 94% accuracy compared to 73% accuracy using previous methods. Implementation of engagement-focused interventions increased average customer engagement from 6.2 to 7.1 points, translating to $630,000 additional quarterly revenue based on model predictions. This demonstrates regression analysis converting correlation insights into actionable prediction frameworks for strategic decision-making.
Model Evaluation and Diagnostic Assessment
Regression analysis relies on fundamental assumptions that must be evaluated to ensure valid interpretation and appropriate application of predictive models and statistical inferences. Linearity assumptions require that relationships between predictor and outcome variables follow consistent patterns accurately represented by straight-line equations, while independence assumptions ensure that individual observations do not systematically influence each other in ways that could bias coefficient estimates.
Regression Assumptions: Linear regression assumes (1) linear relationship between variables, (2) independence of observations, (3) normality of residuals, and (4) homoscedasticity (constant variance). Violation of these assumptions affects model validity and prediction reliability, requiring diagnostic evaluation and potential model modifications.
Diagnostic evaluation through residual analysis provides systematic approaches to assumption checking and model validation that support confident application of regression results. Residual plots reveal patterns indicating assumption violations, such as curved relationships suggesting non-linearity, or systematic variance changes indicating heteroscedasticity that could affect prediction reliability. Outlier identification through standardized residuals and leverage statistics helps analysts understand which observations most strongly influence model results and whether unusual cases require special attention or model modification.
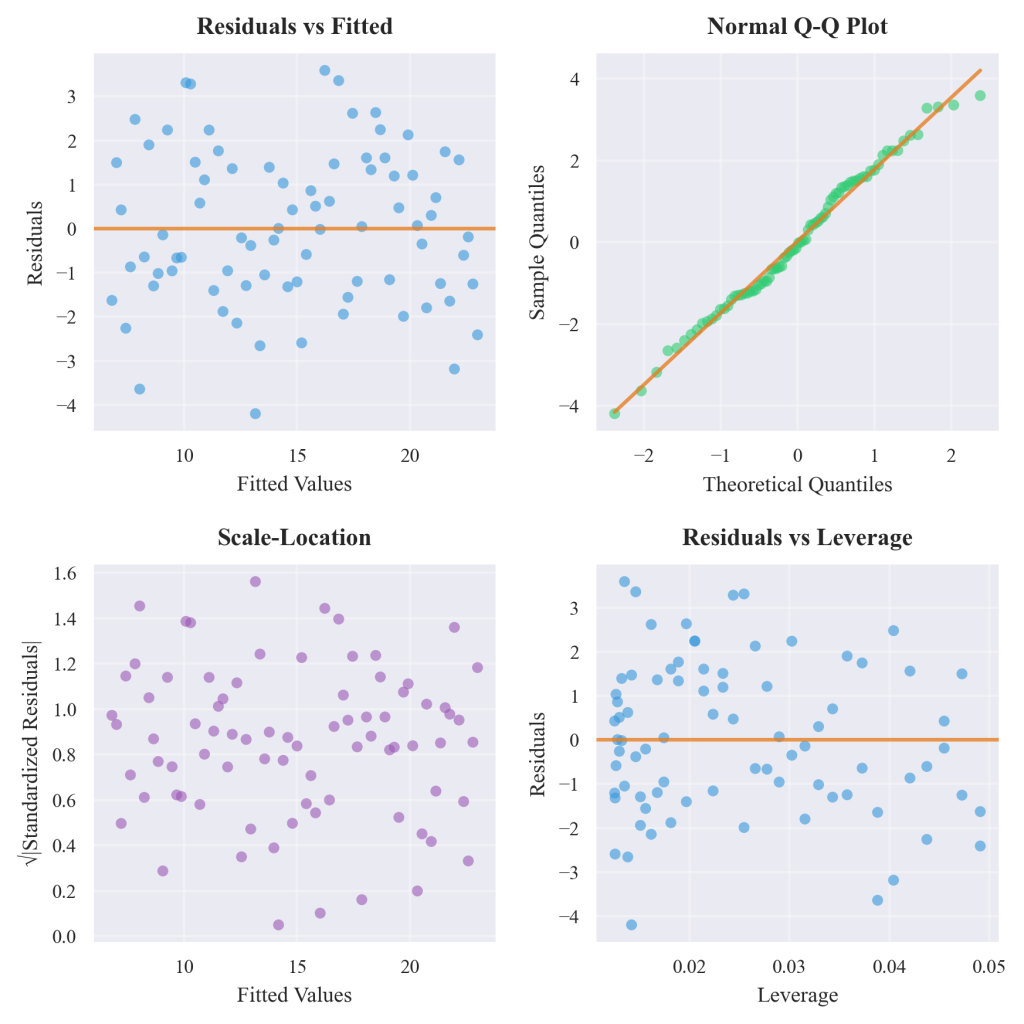
Figure 6.5.2: Regression diagnostic plots provide systematic evaluation of model assumptions through residual analysis patterns. The four-panel display includes residual versus fitted plots for linearity assessment, normal probability plots for residual distribution evaluation, and diagnostic indicators for outlier identification and assumption validation.
Statistical Software Implementation
JASP Regression Analysis Procedures
Statistical software provides comprehensive regression analysis capabilities through intuitive interfaces and professional output options that support predictive modeling with statistical rigor and diagnostic validation. JASP regression procedures access through Regression → Linear Regression menu options, including model fit evaluation through R² and F-statistics, coefficient estimation with confidence intervals and significance tests, and residual analysis capabilities for assumption checking and diagnostic assessment.
Advanced regression features support comprehensive model evaluation through diagnostic plots including residual plots for assumption checking, quantile-quantile plots for normality assessment, and predicted versus residual plots for homoscedasticity evaluation. Professional regression analysis output focuses on model summary statistics for overall fit assessment, coefficient tables for relationship interpretation, and residual statistics for model validation and diagnostic evaluation procedures.
Modern statistical software incorporates advanced diagnostic capabilities that facilitate comprehensive model validation through automated assumption checking and professional visualization options. Output interpretation emphasizes both statistical measures for validity assessment and practical interpretation guidelines for converting mathematical relationships into actionable insights across diverse application domains.
Contemporary Applications and Industry Practice
Sector-Specific Applications
Retail Operations: Revenue forecasting through regression analysis of foot traffic patterns, advertising expenditure relationships, and seasonal trend modeling. Retailers utilize regression models to predict sales volume from promotional activities, optimize inventory levels based on demand patterns, and evaluate the quantified impact of marketing investments on revenue outcomes.
Healthcare Systems: Resource planning applications include patient volume prediction from historical patterns, staffing requirement forecasting based on patient loads, and treatment outcome modeling from intervention intensity variables. Healthcare organizations apply regression analysis to optimize resource allocation, predict capacity requirements, and evaluate treatment effectiveness through systematic outcome measurement.
Manufacturing Operations: Quality control applications utilize regression modeling to predict defect rates from production variables, forecast maintenance costs based on equipment characteristics, and quantify efficiency improvements from process modifications. Manufacturing organizations implement regression analysis for predictive maintenance scheduling, quality optimization, and operational efficiency enhancement initiatives.
Advanced Interpretation and Research Standards
Modern regression analysis incorporates advanced methodological considerations including effect size interpretation, confidence interval emphasis, and comprehensive assumption evaluation that reflect current best practices in quantitative research. Contemporary approaches emphasize practical significance alongside statistical significance, ensuring that regression findings support meaningful conclusions about real-world relationships and their implications for theory and practice.
Interpretive Standards: Current research standards emphasize comprehensive model validation through multiple diagnostic approaches, robust interpretation frameworks that consider both statistical and practical importance, and transparent reporting of model limitations and assumption evaluations. These methodological advances ensure that regression analysis contributes to reliable knowledge development while supporting evidence-based decision-making across diverse application domains.
Professional regression implementation requires systematic attention to model specification, assumption validation, and appropriate interpretation that balances statistical rigor with practical utility. This comprehensive approach ensures that predictive modeling contributes to organizational effectiveness while maintaining methodological integrity and supporting confident strategic decision-making based on quantified relationship assessments.
References
Adhikari, A., DeNero, J., & Wagner, D. (2022). Computational and inferential thinking: The foundations of data science (2nd ed.). https://inferentialthinking.com/
Irizarry, R. A. (2024). Introduction to data science: Statistics and prediction algorithms through case studies. https://rafalab.dfci.harvard.edu/dsbook-part-2/
Lee, S. (2025). Understanding effect size: A comprehensive research guide. Number Analytics. https://www.numberanalytics.com/blog/understanding-effect-size-research-guide
Timbers, T., Campbell, T., & Lee, M. (2024). Data science: A first introduction. https://datasciencebook.ca/
